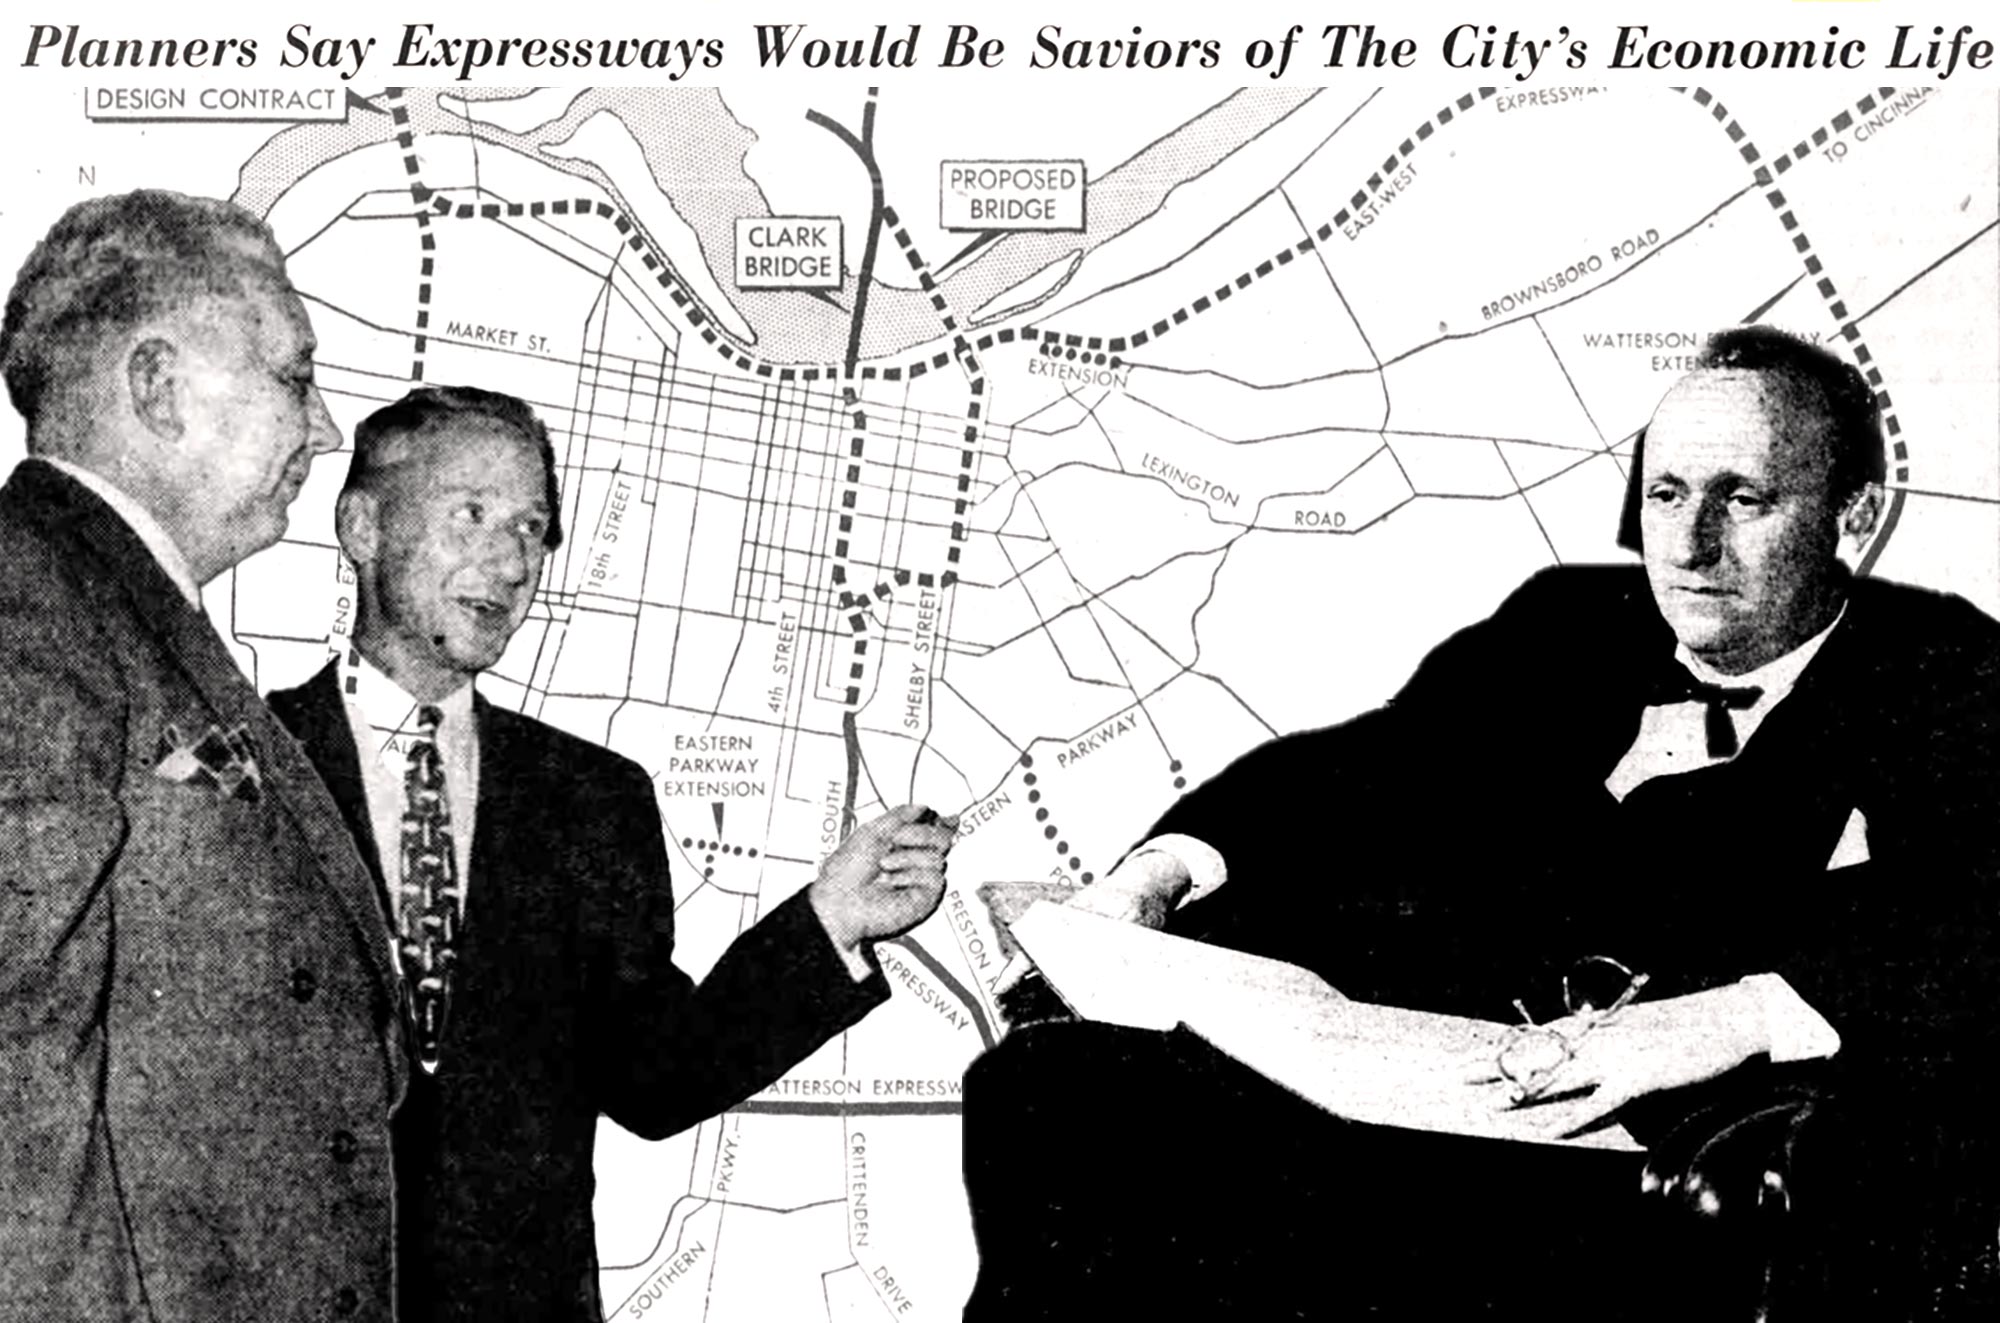
It has been roughly 4 years since the last major tree canopy assessment in Louisville. One of the primary functions of these assessments is to see the loss or gain of canopy in Louisville over recent years. The 2012 assessment (released in 2015) indicated that Louisville was losing tree canopy, while the 2019 assessment (released in 2022) indicated we had begun to reverse that trend with a slight increase in canopy.
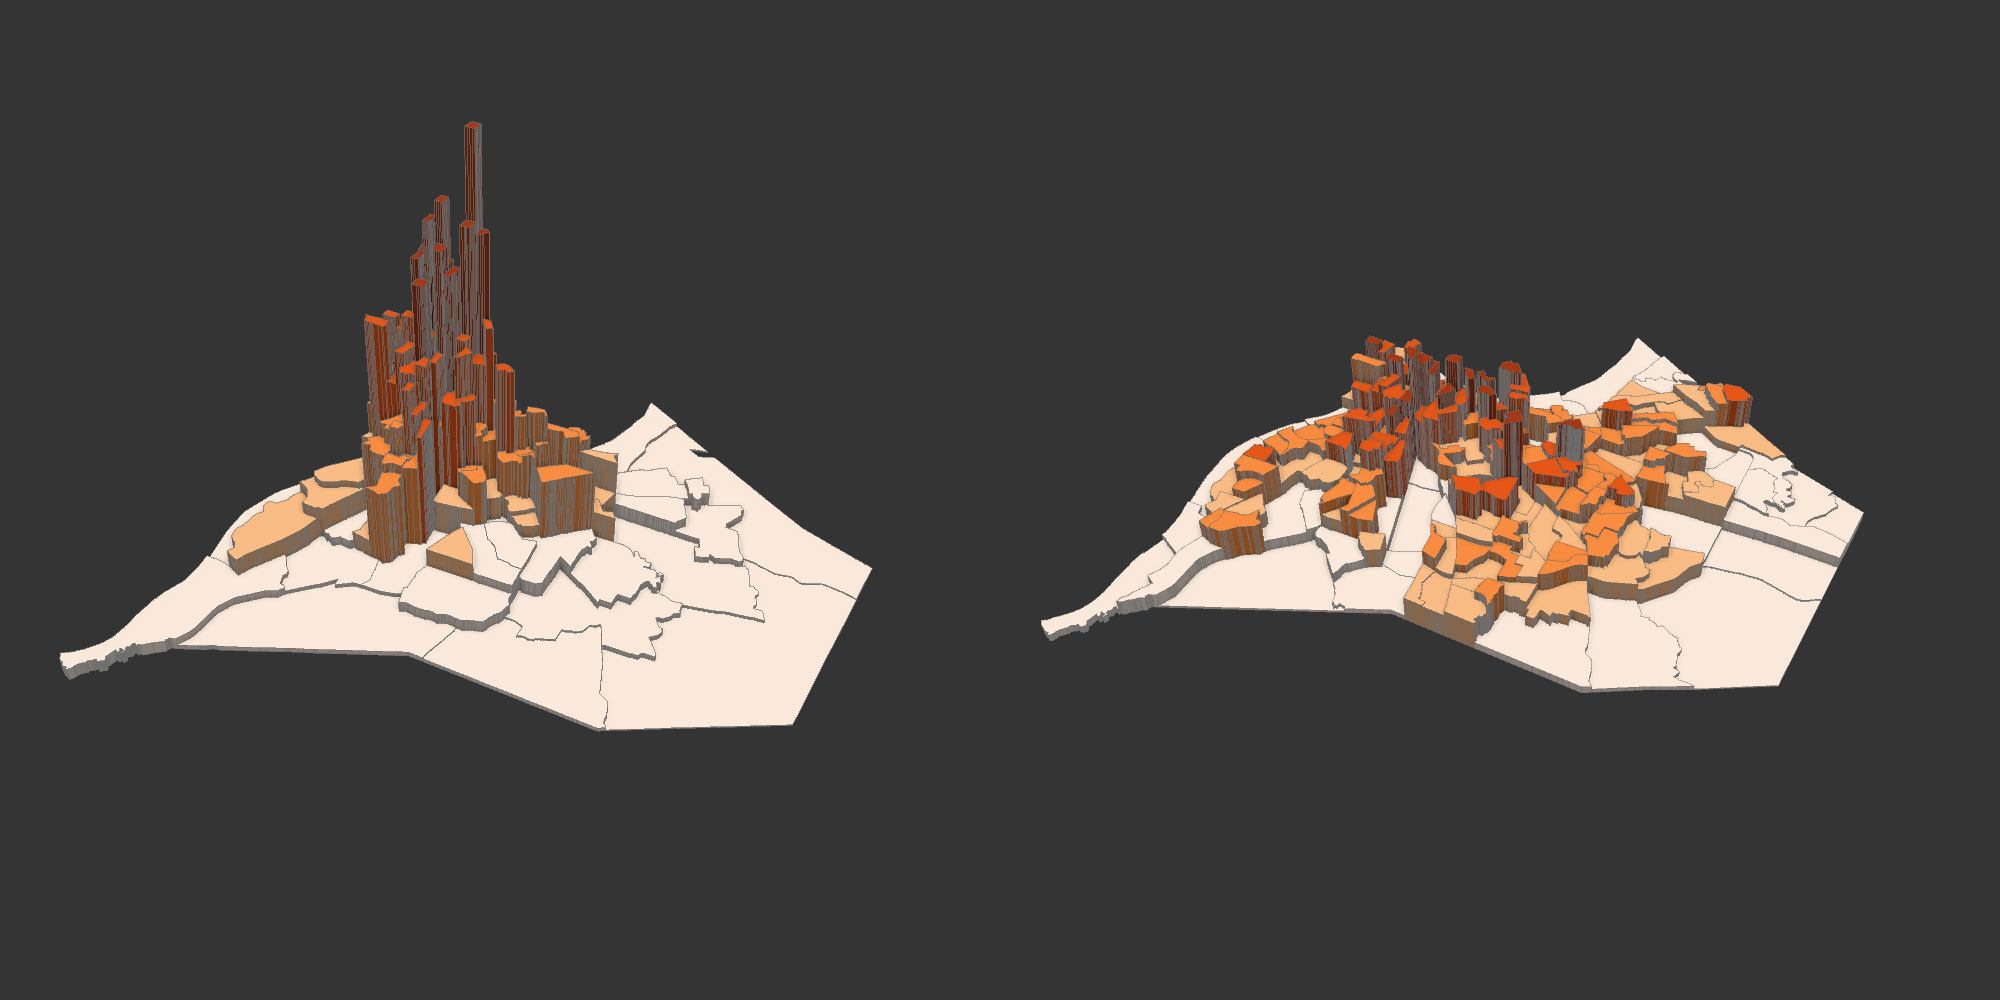
It is vital to understand land cover patterns in our city and how tree canopy is changing. The contraction of tree canopy is one of the primary causes of the urban heat island effect; the spreading of tree canopy is one of the most effective ways to fight the urban heat island. A study conducted around the same time as the second tree canopy assessment indicated that Louisville had the fastest-growing urban heat island in the nation. While this has likely been mitigated to some extent since, the Metro area still has a strong heat island. This urban heat can cause issues for health (heat stroke, cardiovascular problems, respiratory issues, etc.) and issues for quality of life (reduced mobility, increased utility bills, etc.). This makes the heat island a significant barrier to urban vitality, especially in Louisville.
While the recently completed Louisville Urban Forest Master Plan calls for conducting another assessment in the near future, this has yet to take place. In the meantime, we can utilize National Agriculture Imagery Program (NAIP) satellite imagery to get an idea of how canopy may have changed over recent years. The most recent imagery from NAIP for Kentucky is from 2022 and we will be using 2016 as our point of comparison. This imagery was classified using deep learning in ArcGIS Pro, which allows the identification of specific land types (impervious, canopy, buildings, and so on).
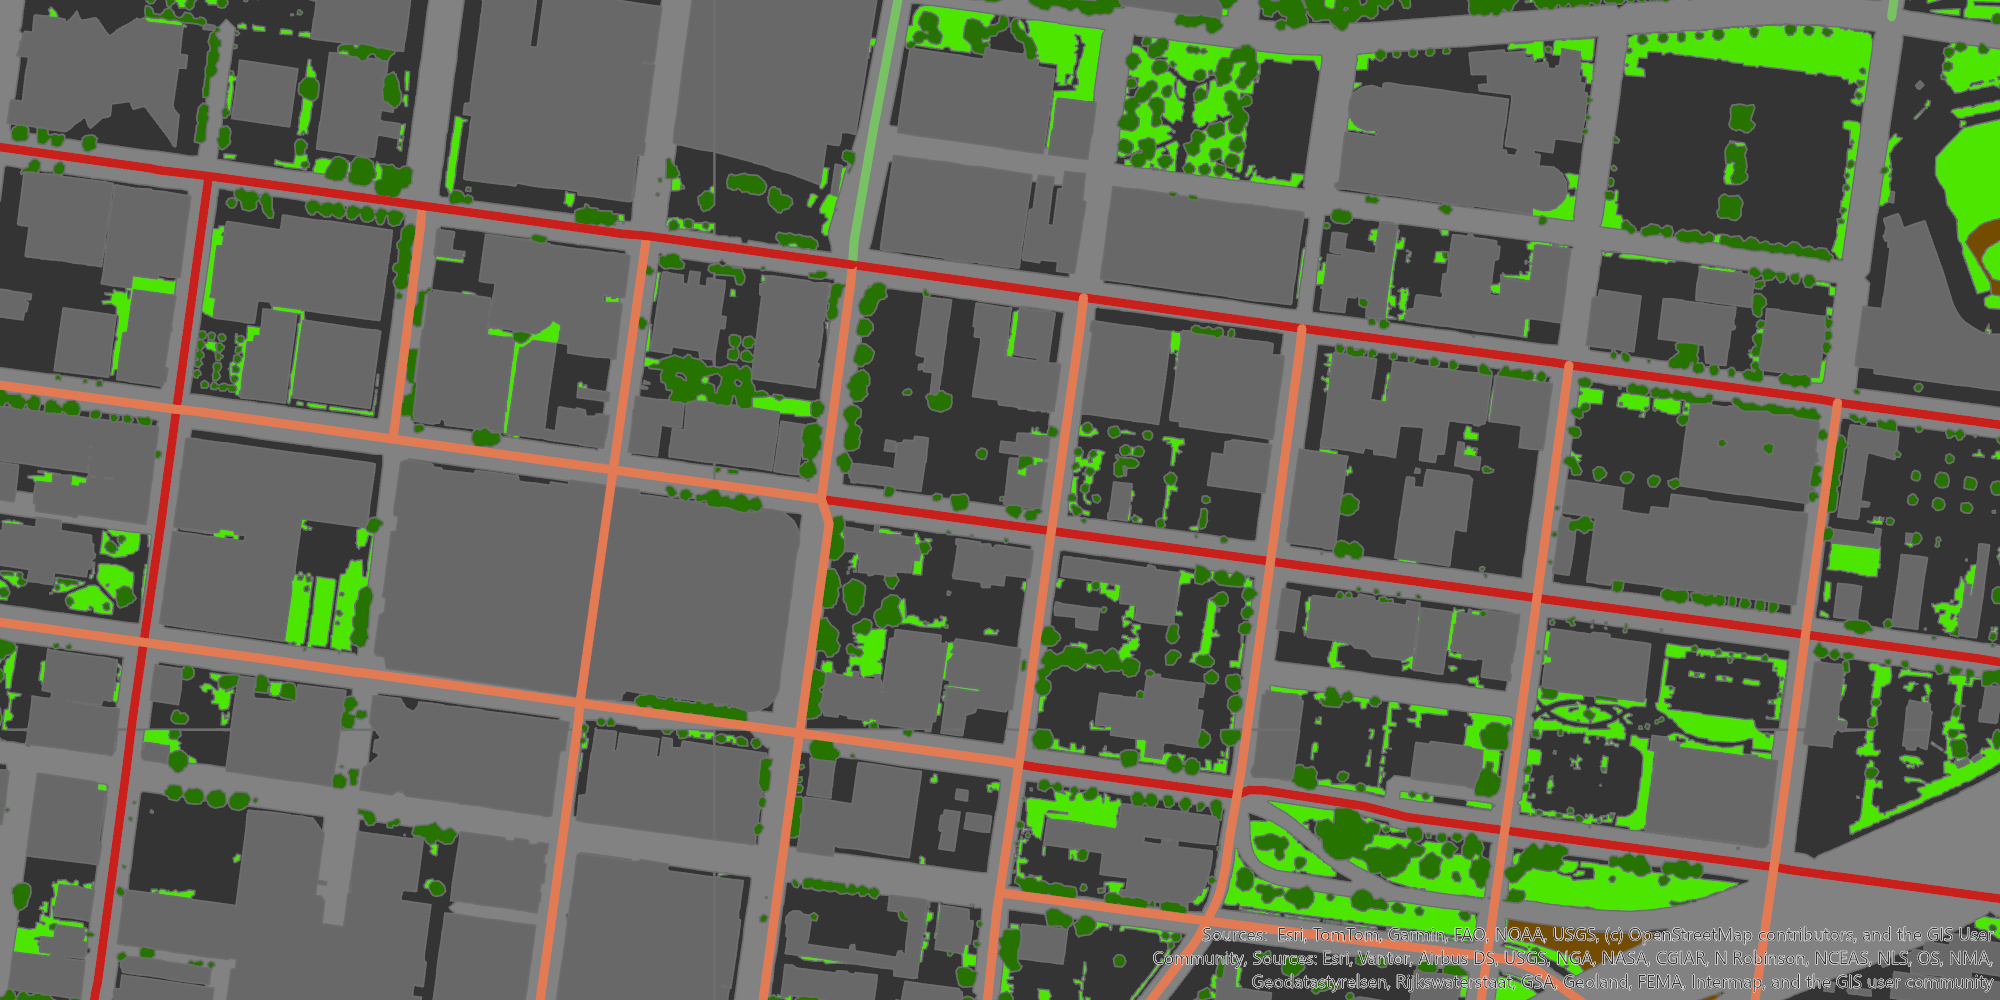
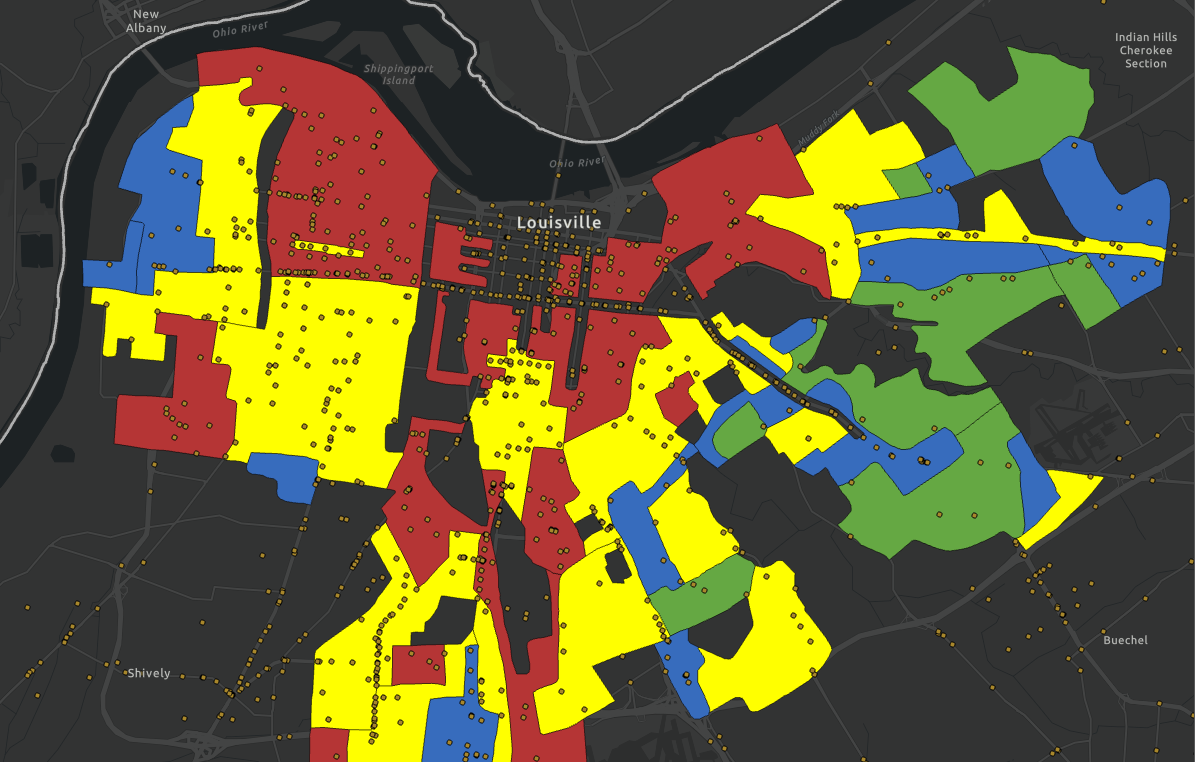
Based on the NAIP imagery, Jefferson County’s total canopy coverage decreased from 38.74% in 2016 to 37.84% in 2022. The canopy growth that occurred during 2012 to 2019, according to the urban tree canopy assessment, has seemingly reversed. While this is not a positive development, the decrease is small enough to where it could be caused by issues with the classification algorithm. The most important takeaways can be ascertained by looking at the canopy change at the neighborhood level, which the map below does.
Open the map in its own window
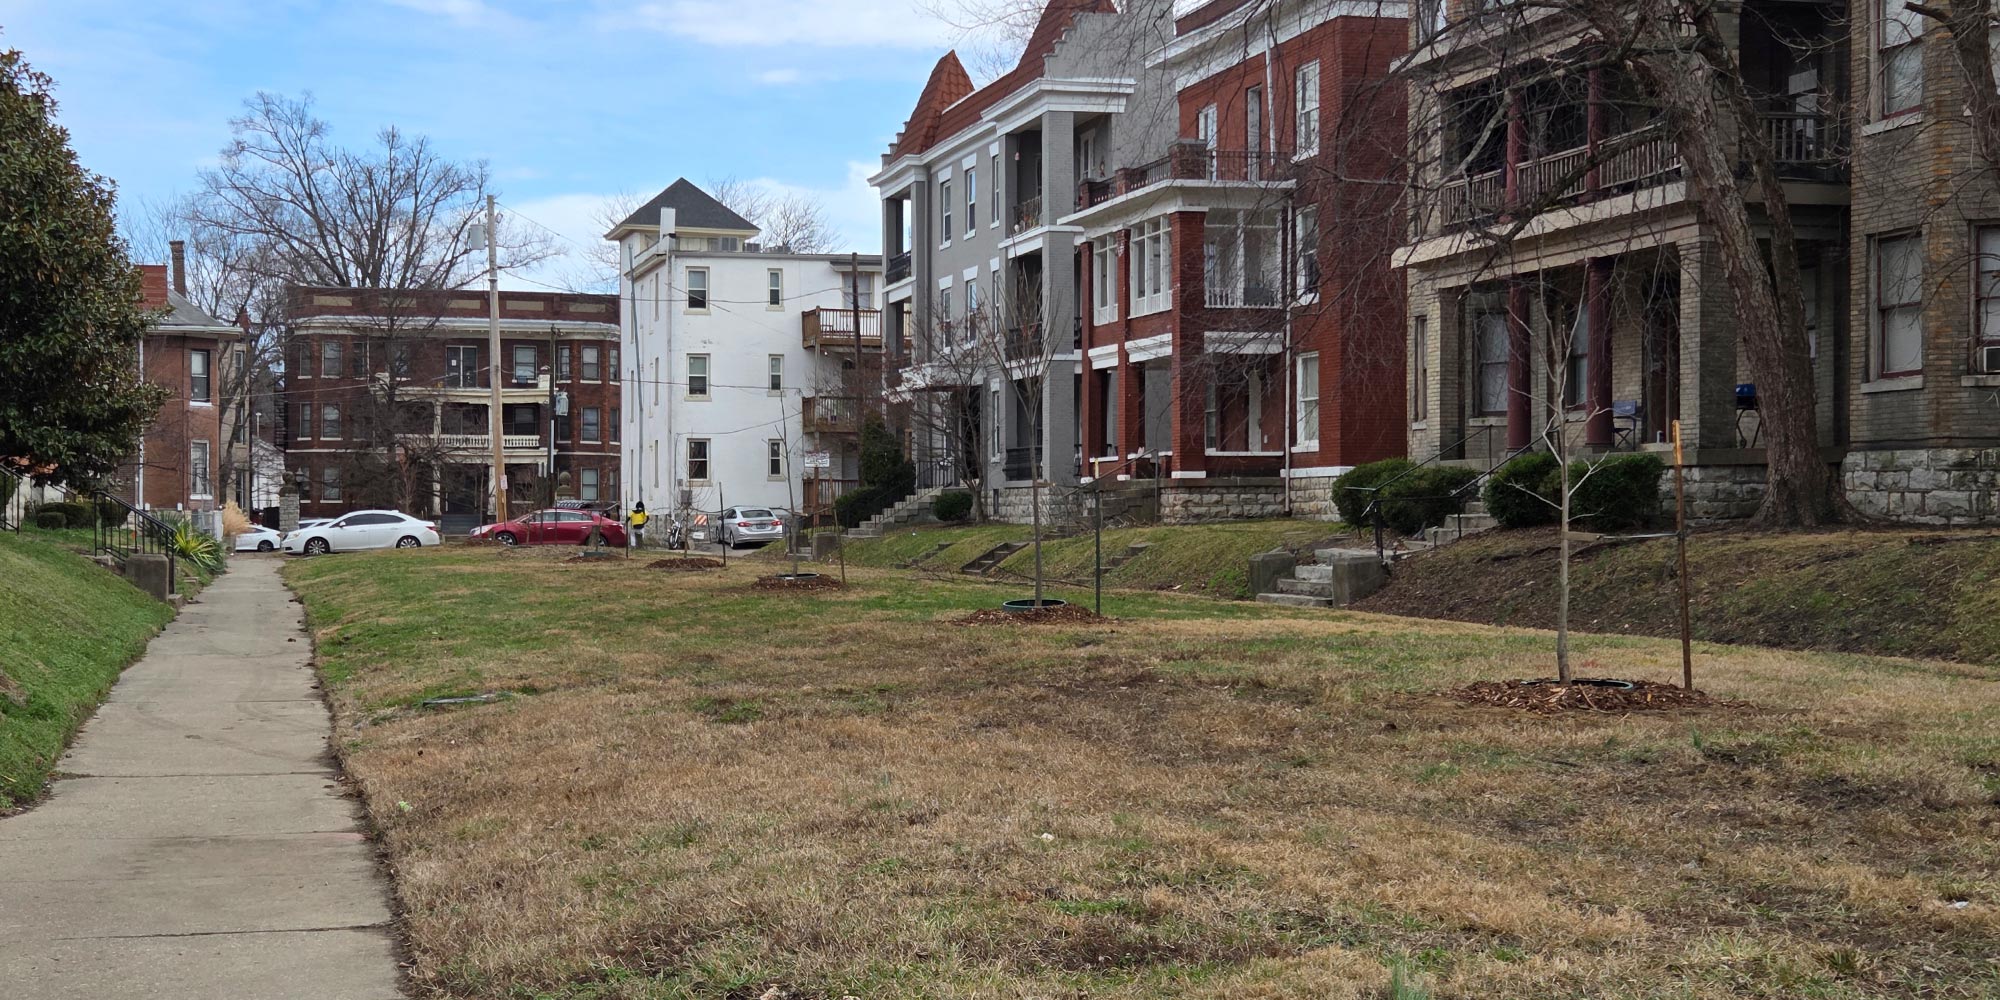
The neighborhoods with red had the most canopy loss, while those with the darker green have had the most significant canopy gain. Based on the map, canopy loss is most extreme in the neighborhoods on the edge of the urban core such as Kenwood Hill, Beechmont, Strathmoor Village, and the Highlands. Canopy gain was more spread out, with some urban neighborhoods such as Portland and Deer Park seeing some gain along with suburban neighborhoods such as Seatonville, Valley Station, and Cedar Creek.
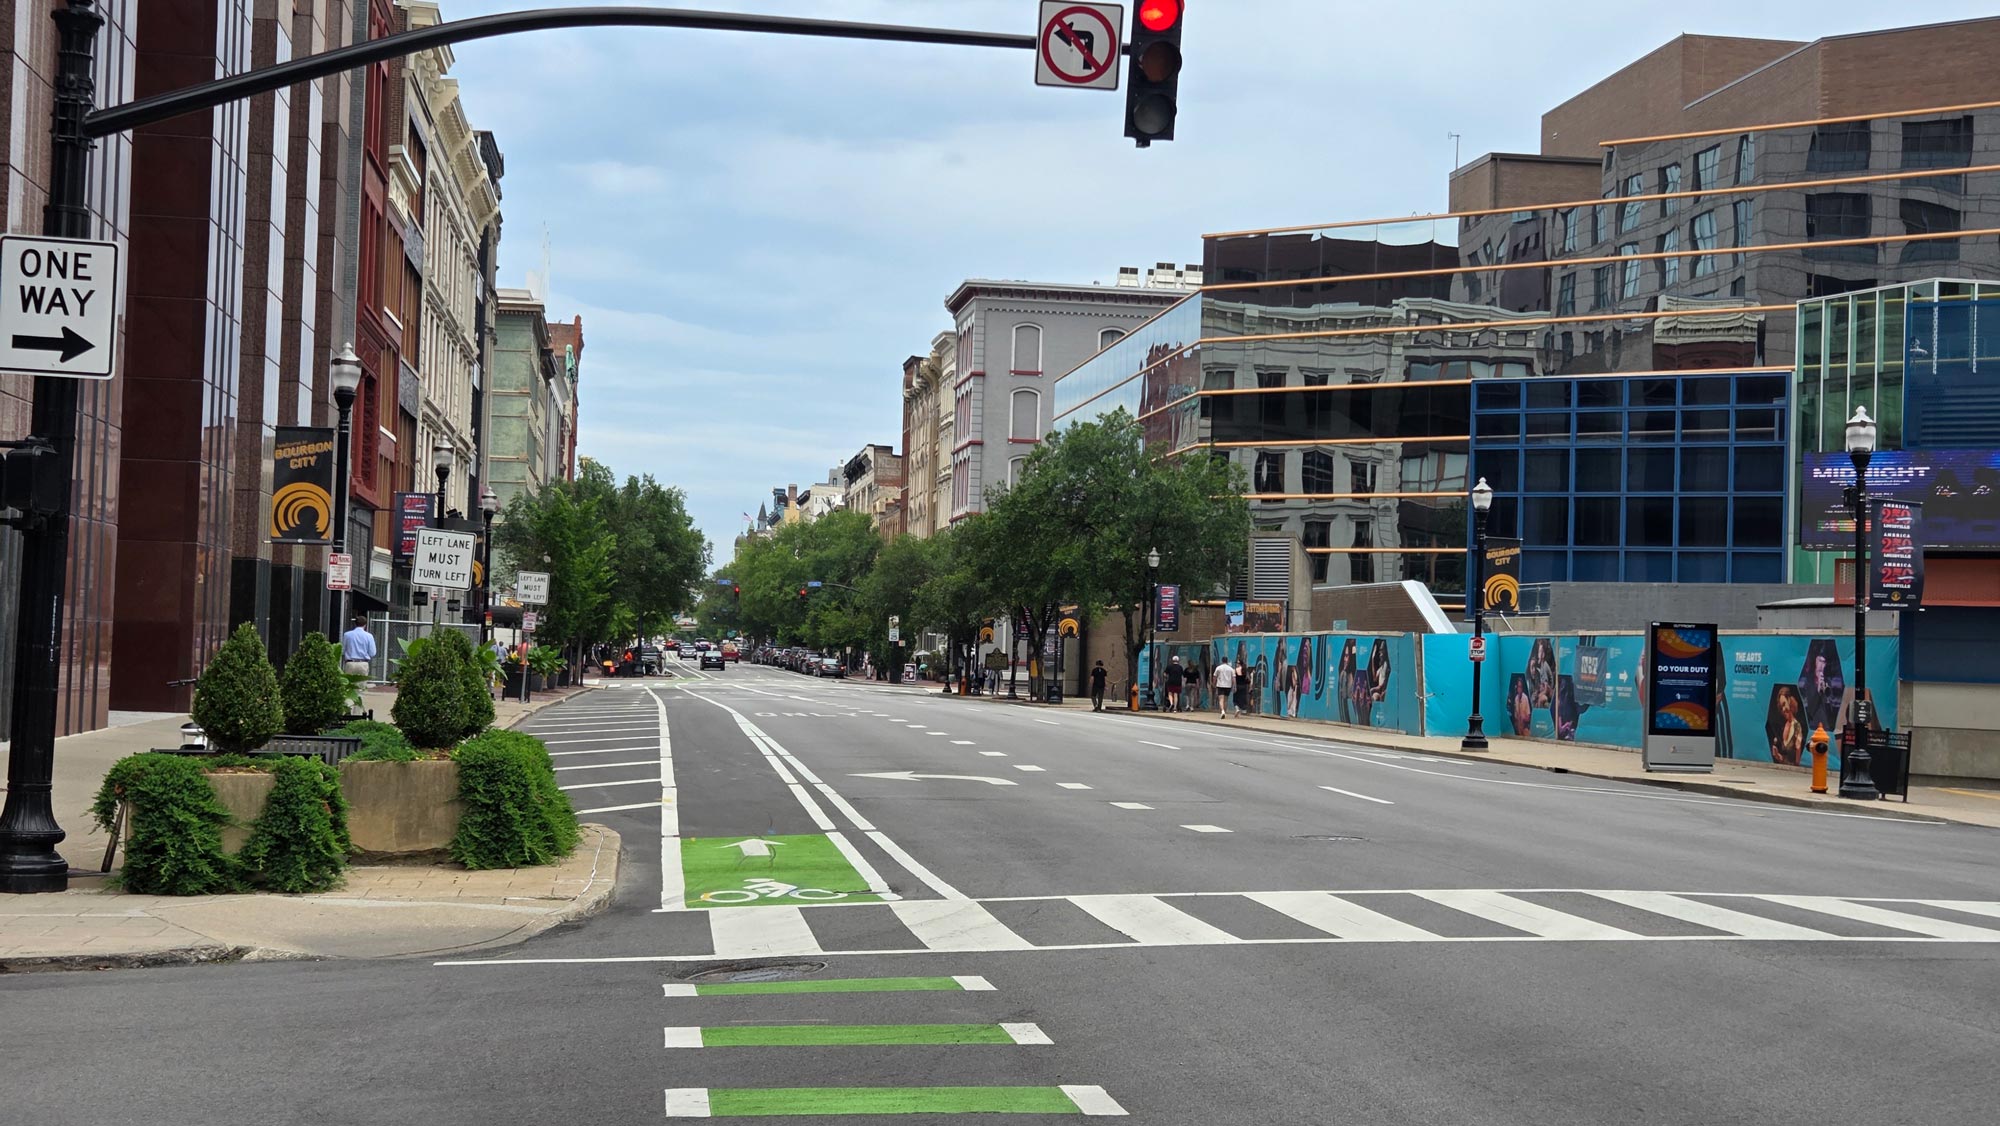
While urban tree canopy reduces urban heat, impervious surfaces such as roads and parking lots exacerbate it. The map also shows what areas had the largest increase in impervious surface area. Some of the results may surprise you, such as Downtown having the biggest change in impervious coverage, but consider tree canopy is not the default replacement for impervious surfaces. Often these lots are developed and turned into structures, which still contribute to the urban heat island unless they utilize cool roof technology.
It should noted that NAIP imagery and the methodology for classifying it comes with limitations. This imagery is 60cm resolution, which is generally pretty reliable, but classifying satellite imagery using deep learning will never be 100% accurate. The 2019 Urban Tree Canopy Asssessment, for example, combined NAIP imagery with LiDAR data to get what is probably the most accurate picture of Louisville’s tree canopy ever made. Since the follow-up to this assessment has not occurred, we did not use the more accurate data and instead utilized NAIP imagery exclusively for both points of comparisons to ensure there was no variation in methodology.
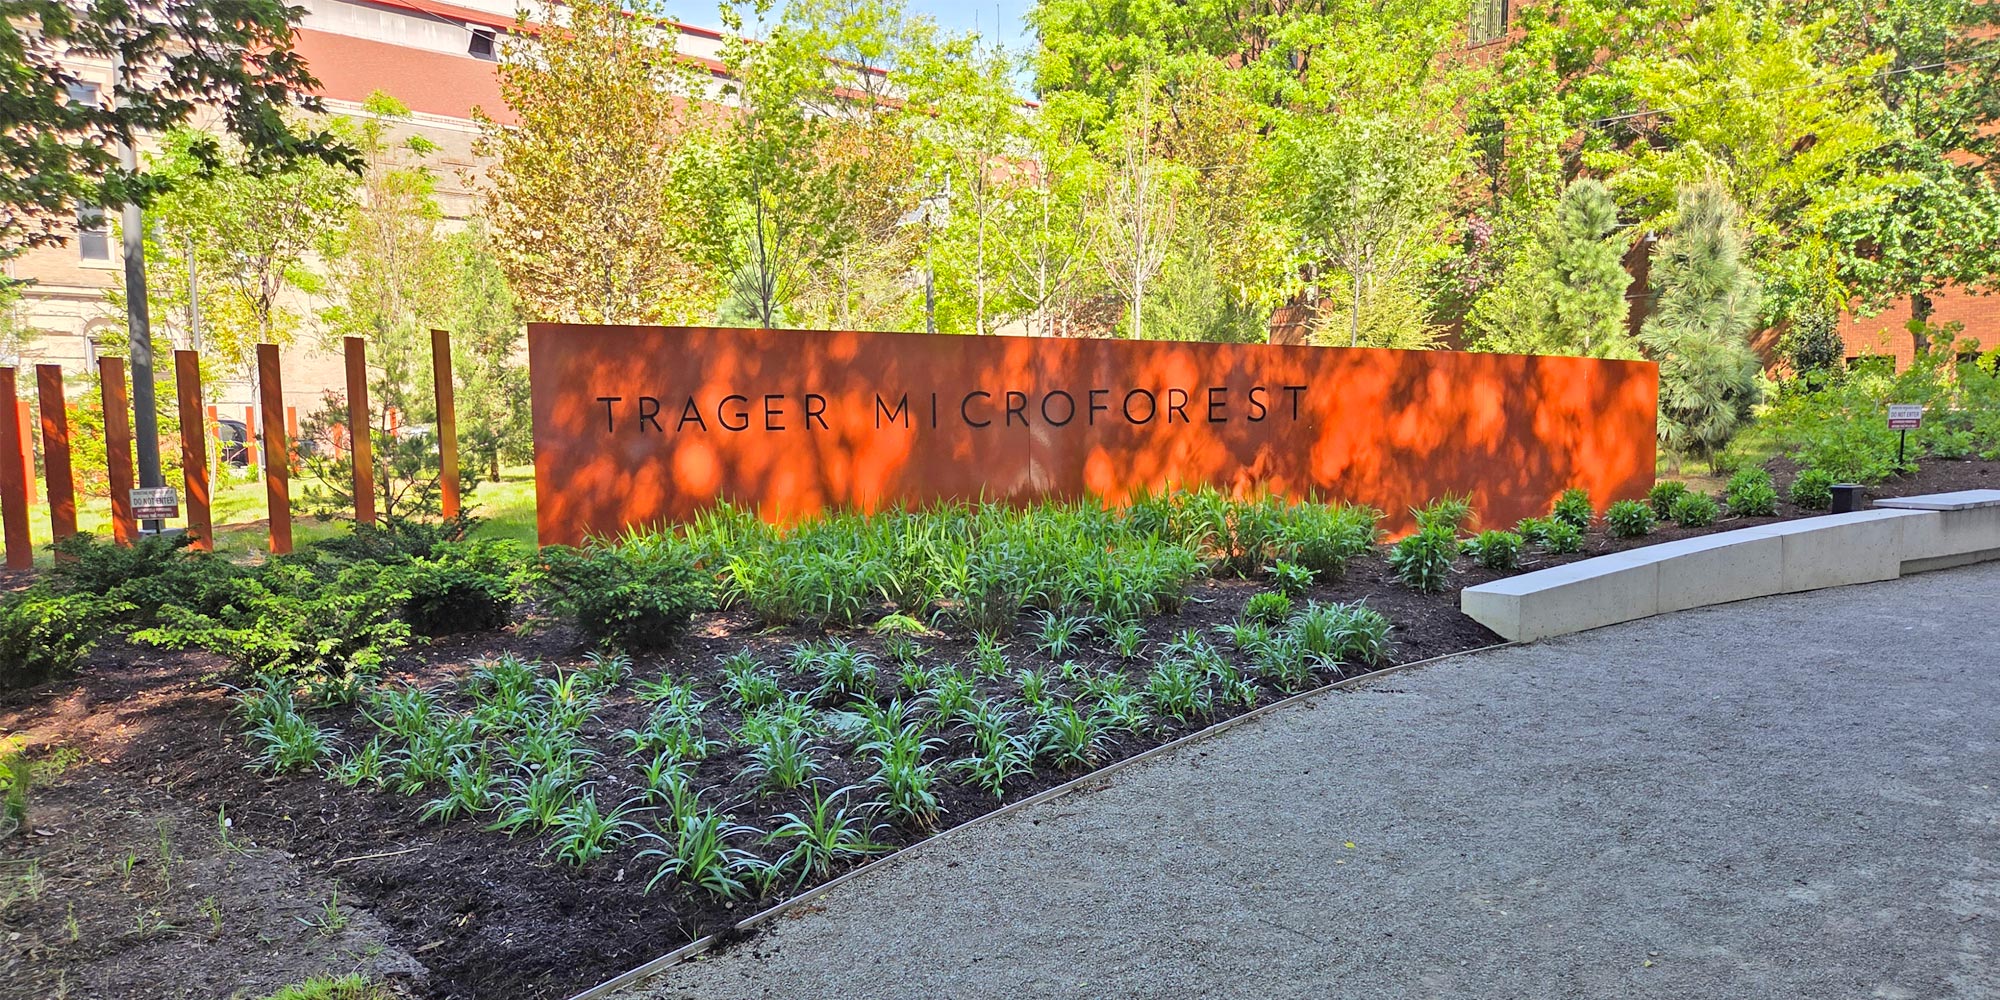
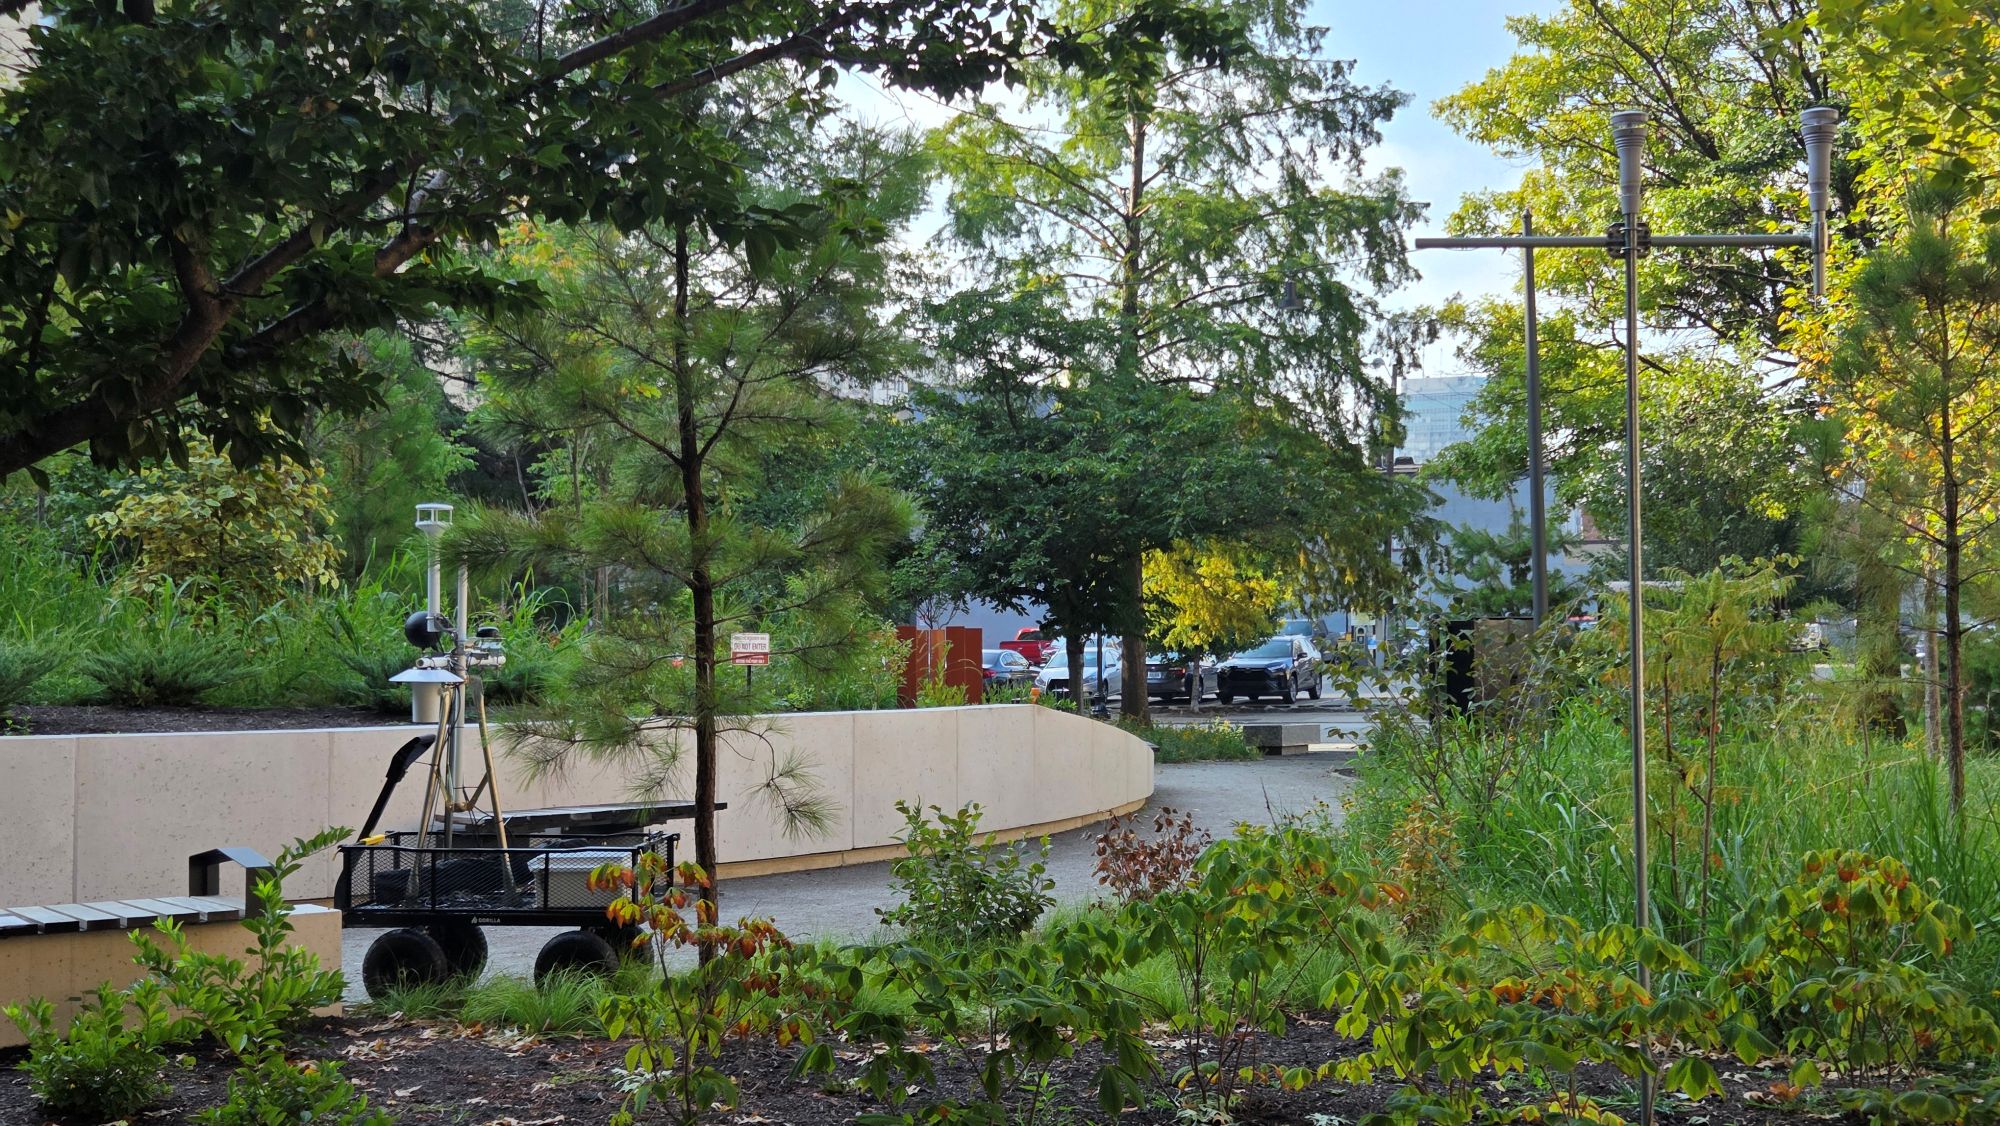
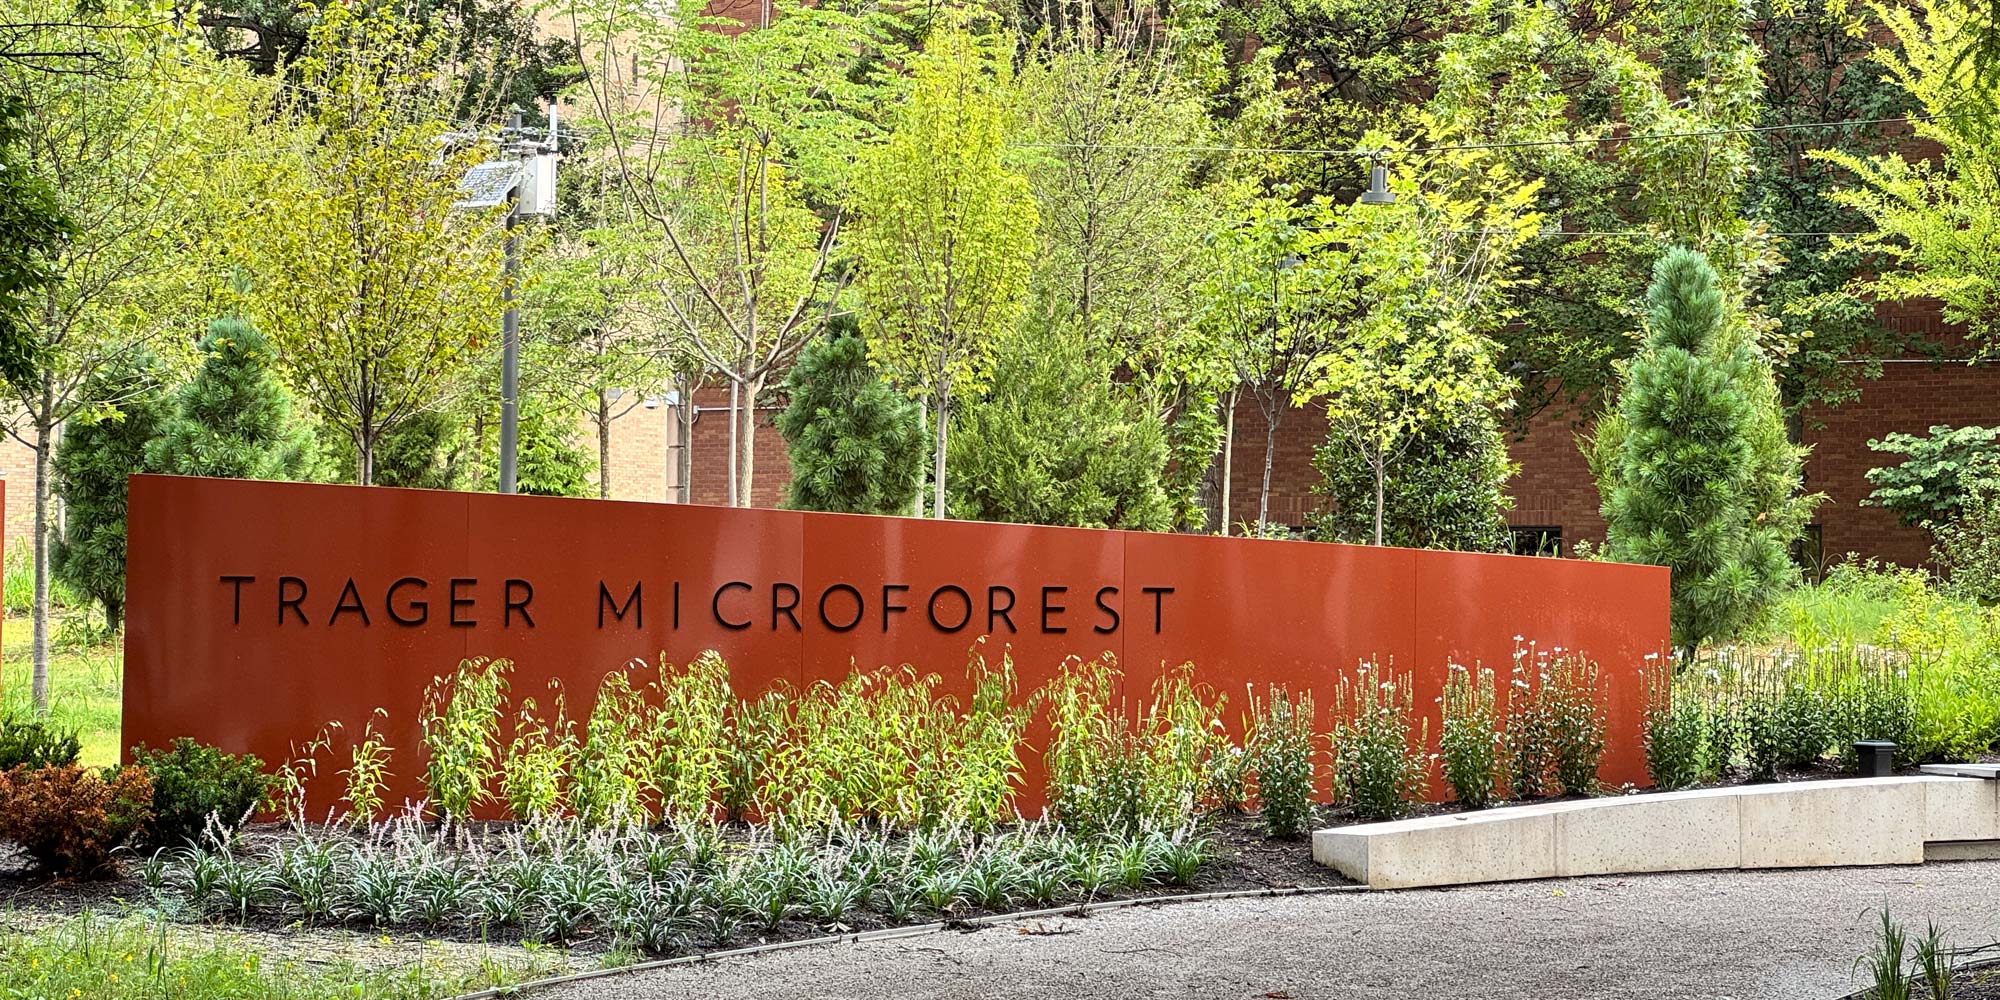
Understanding where tree canopy is declining will be pivotal to target urban greening interventions in the future. Neighborhoods losing canopy will face increasing heat stress and the negative health effects that come with it, and often these neighborhoods are historically underresourced. This will only worsen in the coming years as climate change increases urban heat worldwide. Projects such as our Greenprint initiative seek to address these challenges, among others, within Louisville’s urban core. The Trager MicroForest Project also prioritizes urban heat, although on a smaller scale