It is likely that urban heat will only become more and more of a problem in the coming decades. While many cities are taking steps to curb the urban heat island, they have to contend with the global rise in temperature that is taking place. Louisville is among these cities. We are managing to grow our overall canopy, which is one of the most important steps you can take in fighting urban heat. At the same time, many Louisville neighborhoods are covered with pavement, raising our temperature relative to the surrounding counties. Our city is on the path to being as hot as Louisiana within 60 years.
This increasing heat poses an increasing health risk to urban residents. The heat itself can induce heatstroke and dehydration, of course. The higher temperatures have also been connected to increased risk of cardiovascular morbidity, mental health issues, and respiratory problems. Risk is especially high for vulnerable populations such as children, the elderly, and disabled; millions of Americans are prone to issues with thermoregulation.
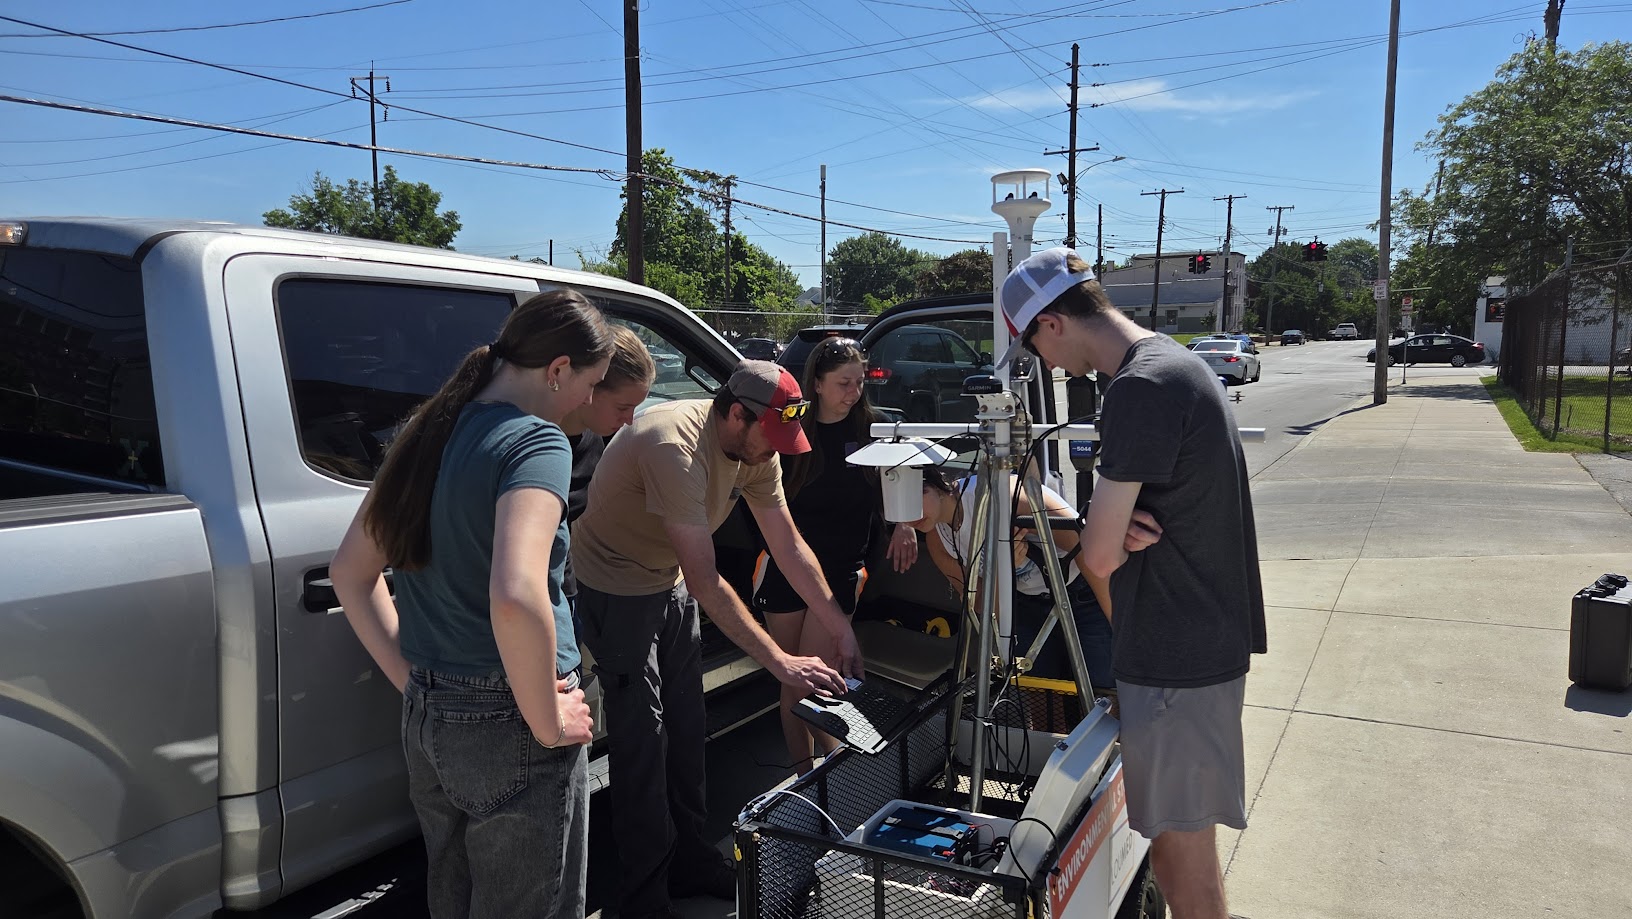
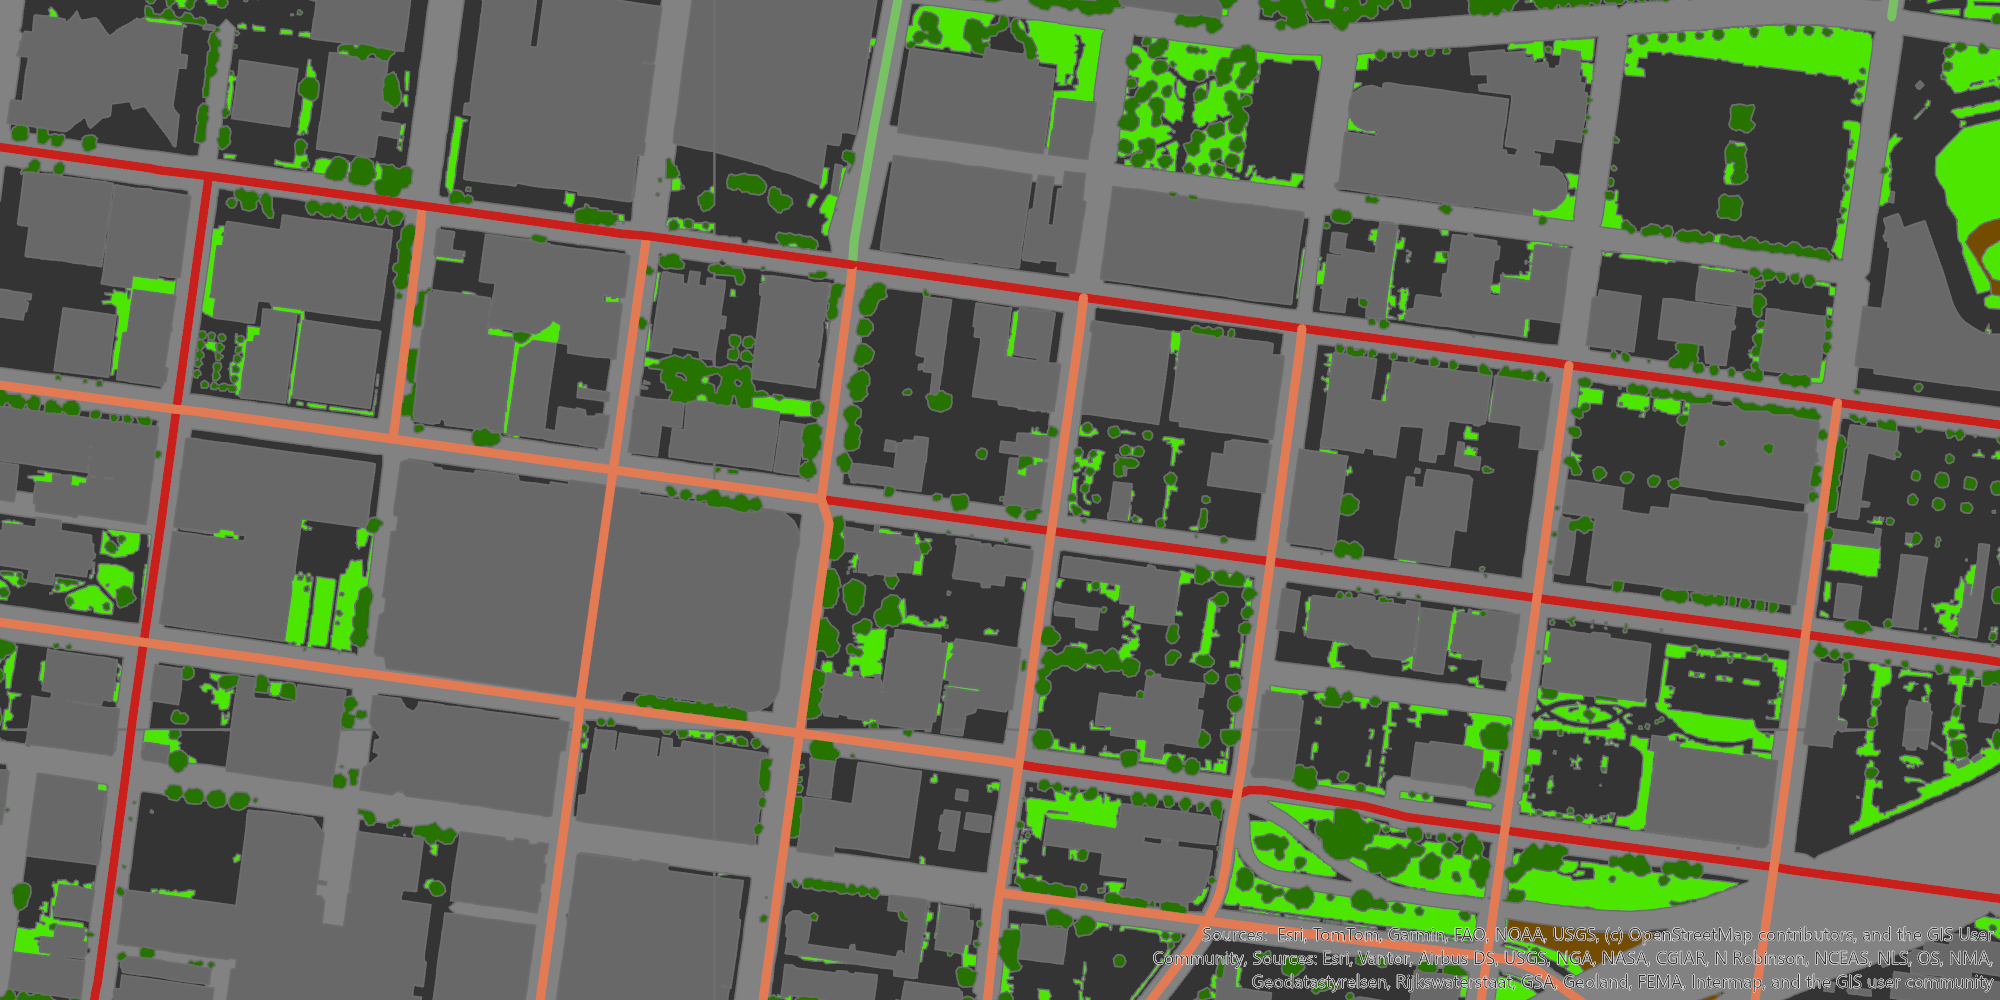
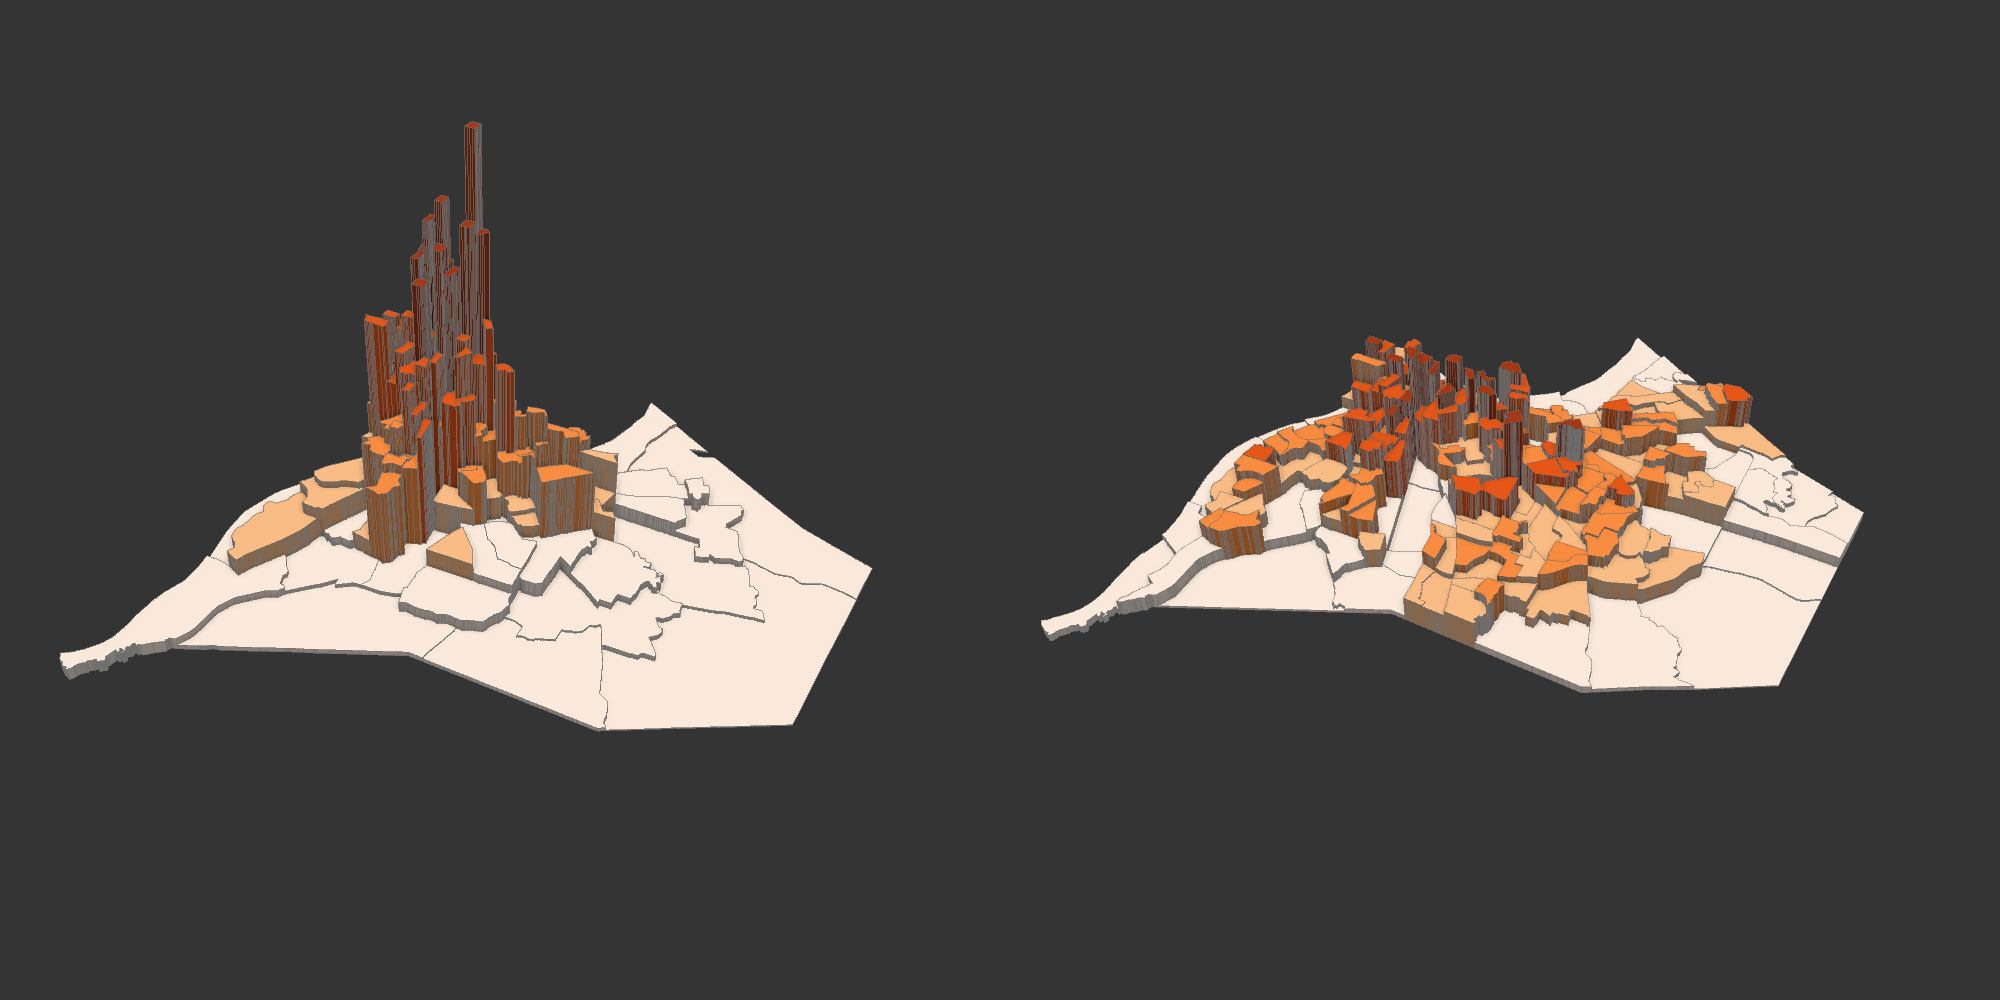
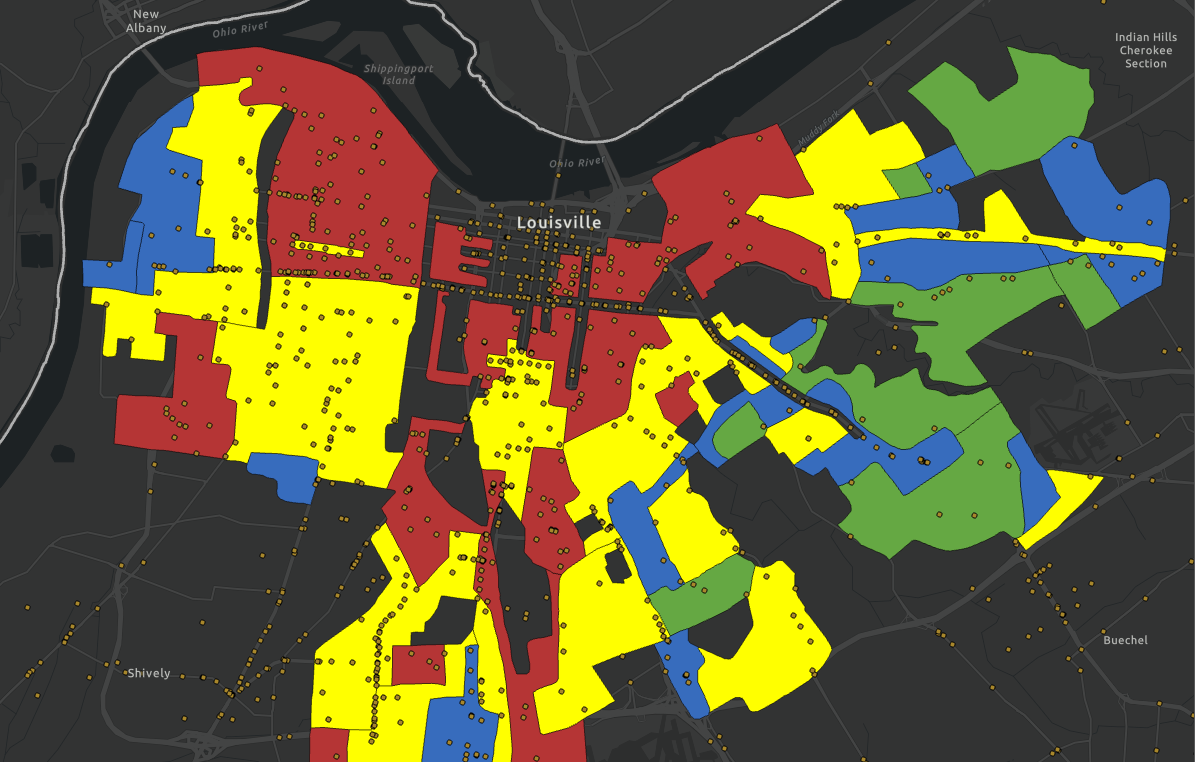
In order to assess the spatial patterns in who is most at risk in Louisville, the map below shows an index that ranks all 216 census tracts in Jefferson County by heat risk. Rank 216 would be the most at risk while rank 1 would be the least. This builds upon the rudimentary heat hotspots map we created in 2023. This index includes land surface temperature data from Landsat (average temperature in summer months from the past 5 years), tree canopy coverage, presence of disabled/vulnerable populations, and population density. This is not a comprehensive index of every single possible factor that could represent heat risk since the list of potentially relevant factors is so extensive as to make weighing them impractical. This index includes some of the basic factors that should be included in any risk assessment.
Click here to go to view the map in its own screen
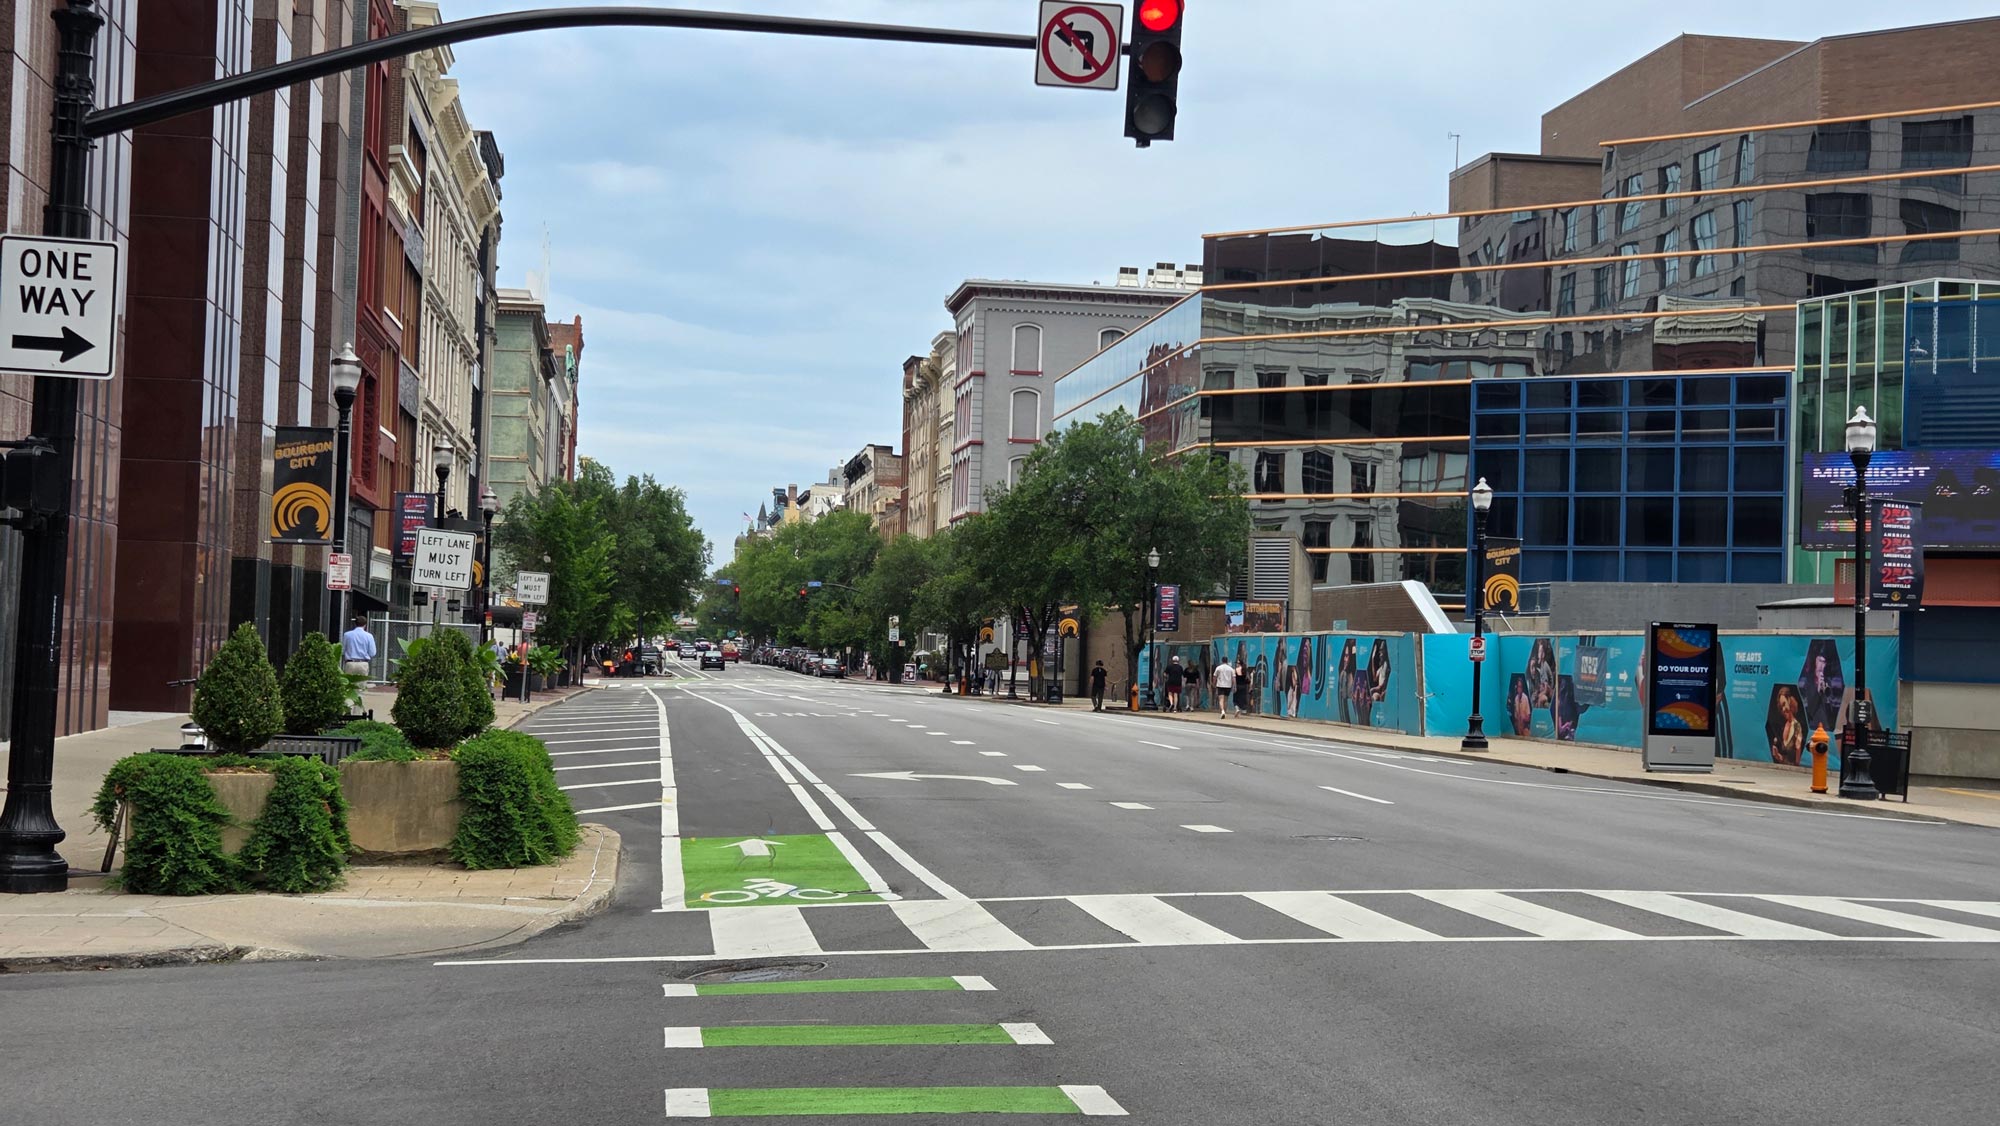
Based on the factors we are utilizing, the most at-risk census track was 59.01. This tract is ironically mostly made up of downtown’s hospital district. The tract has an average summer surface temperature of 113 degrees, likely due to a lack of canopy coverage and high presence of impervious surfaces. The tract also has a dense population of largely older residents inhabiting places like Dosker Manor. This pretty much creates the perfect set of factors to maximize heat risk for vulnerable populations.
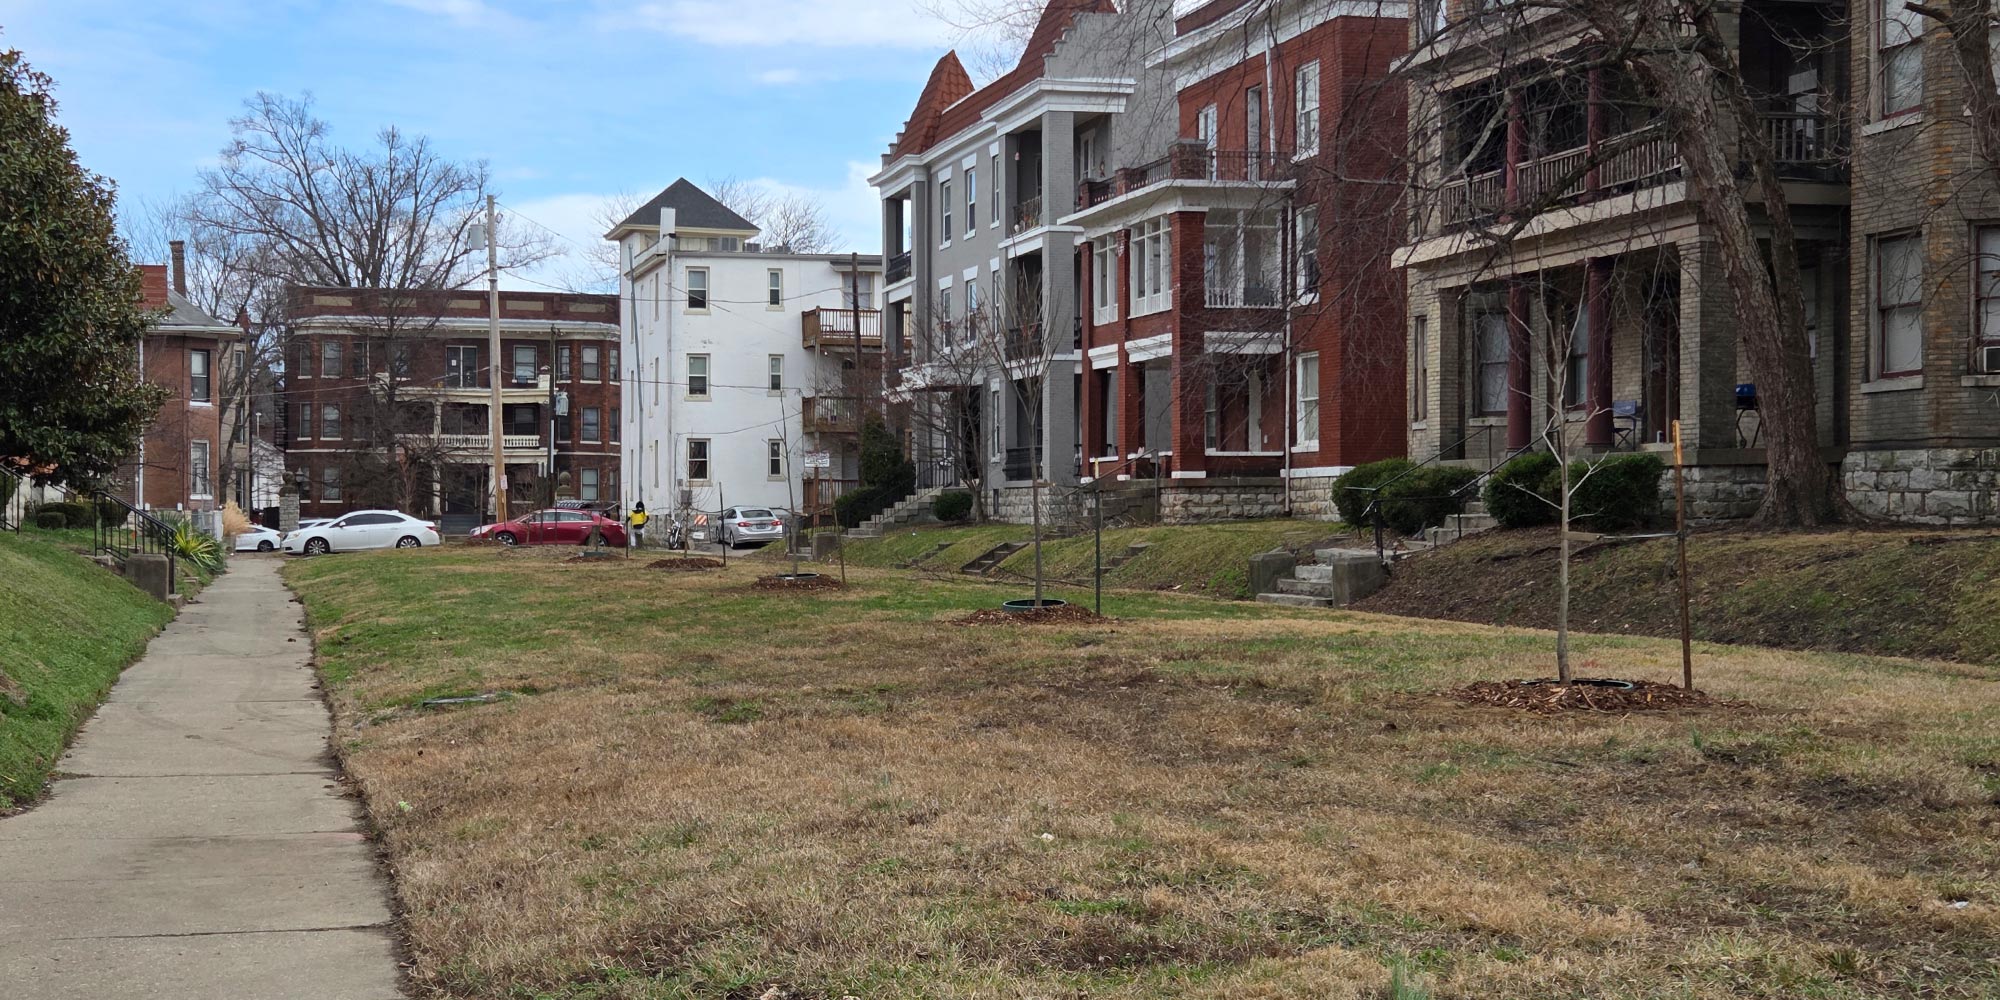
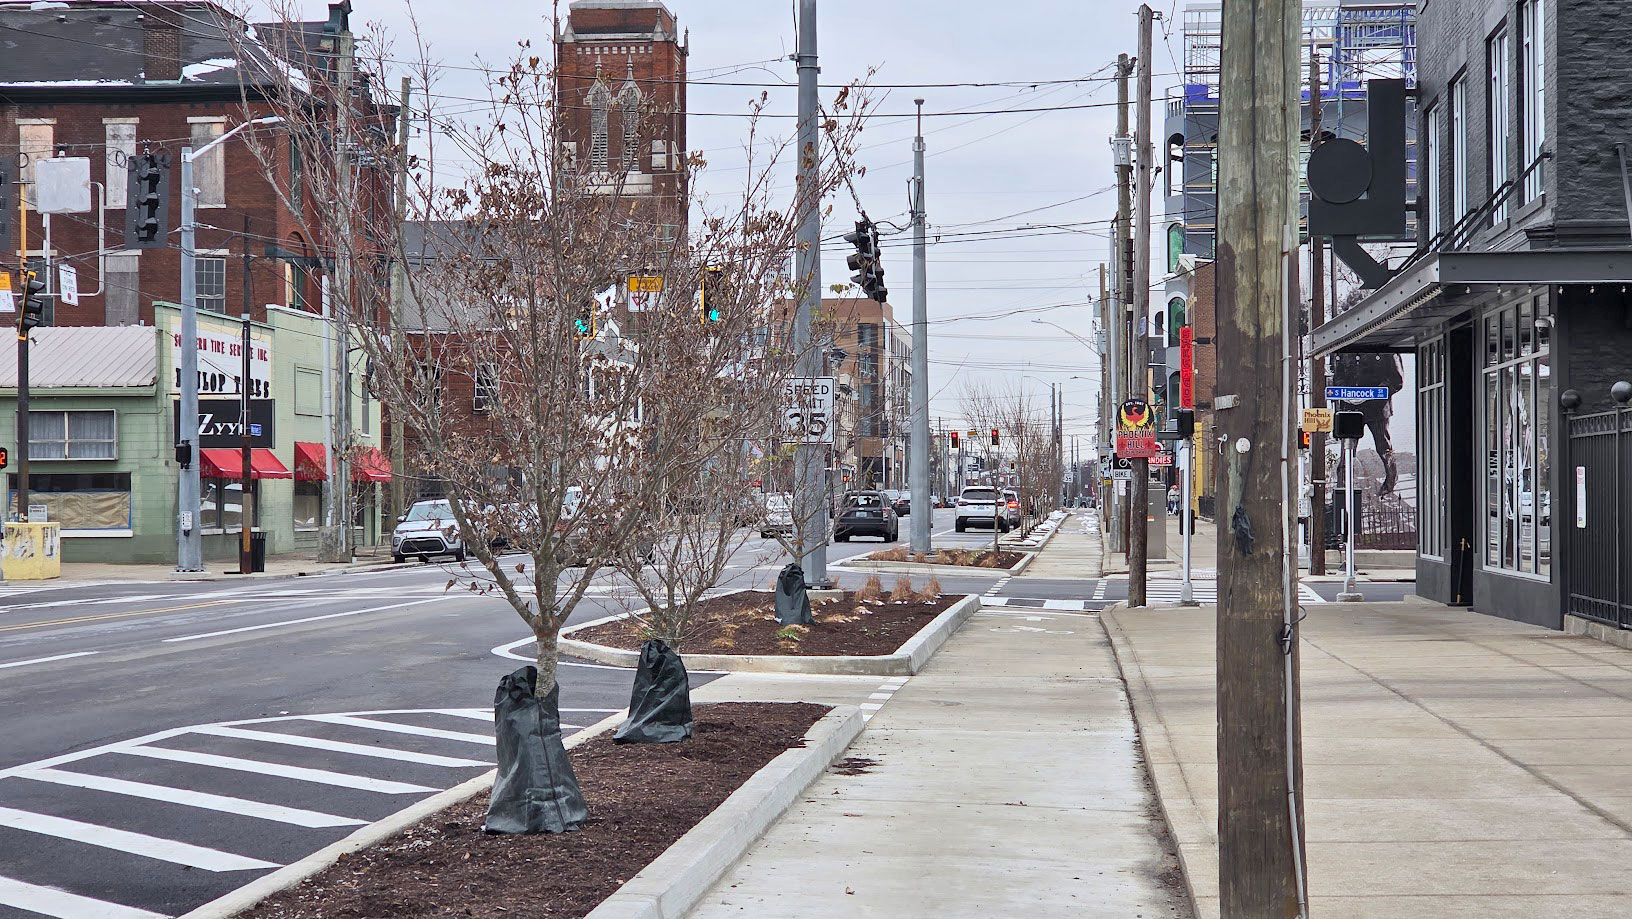
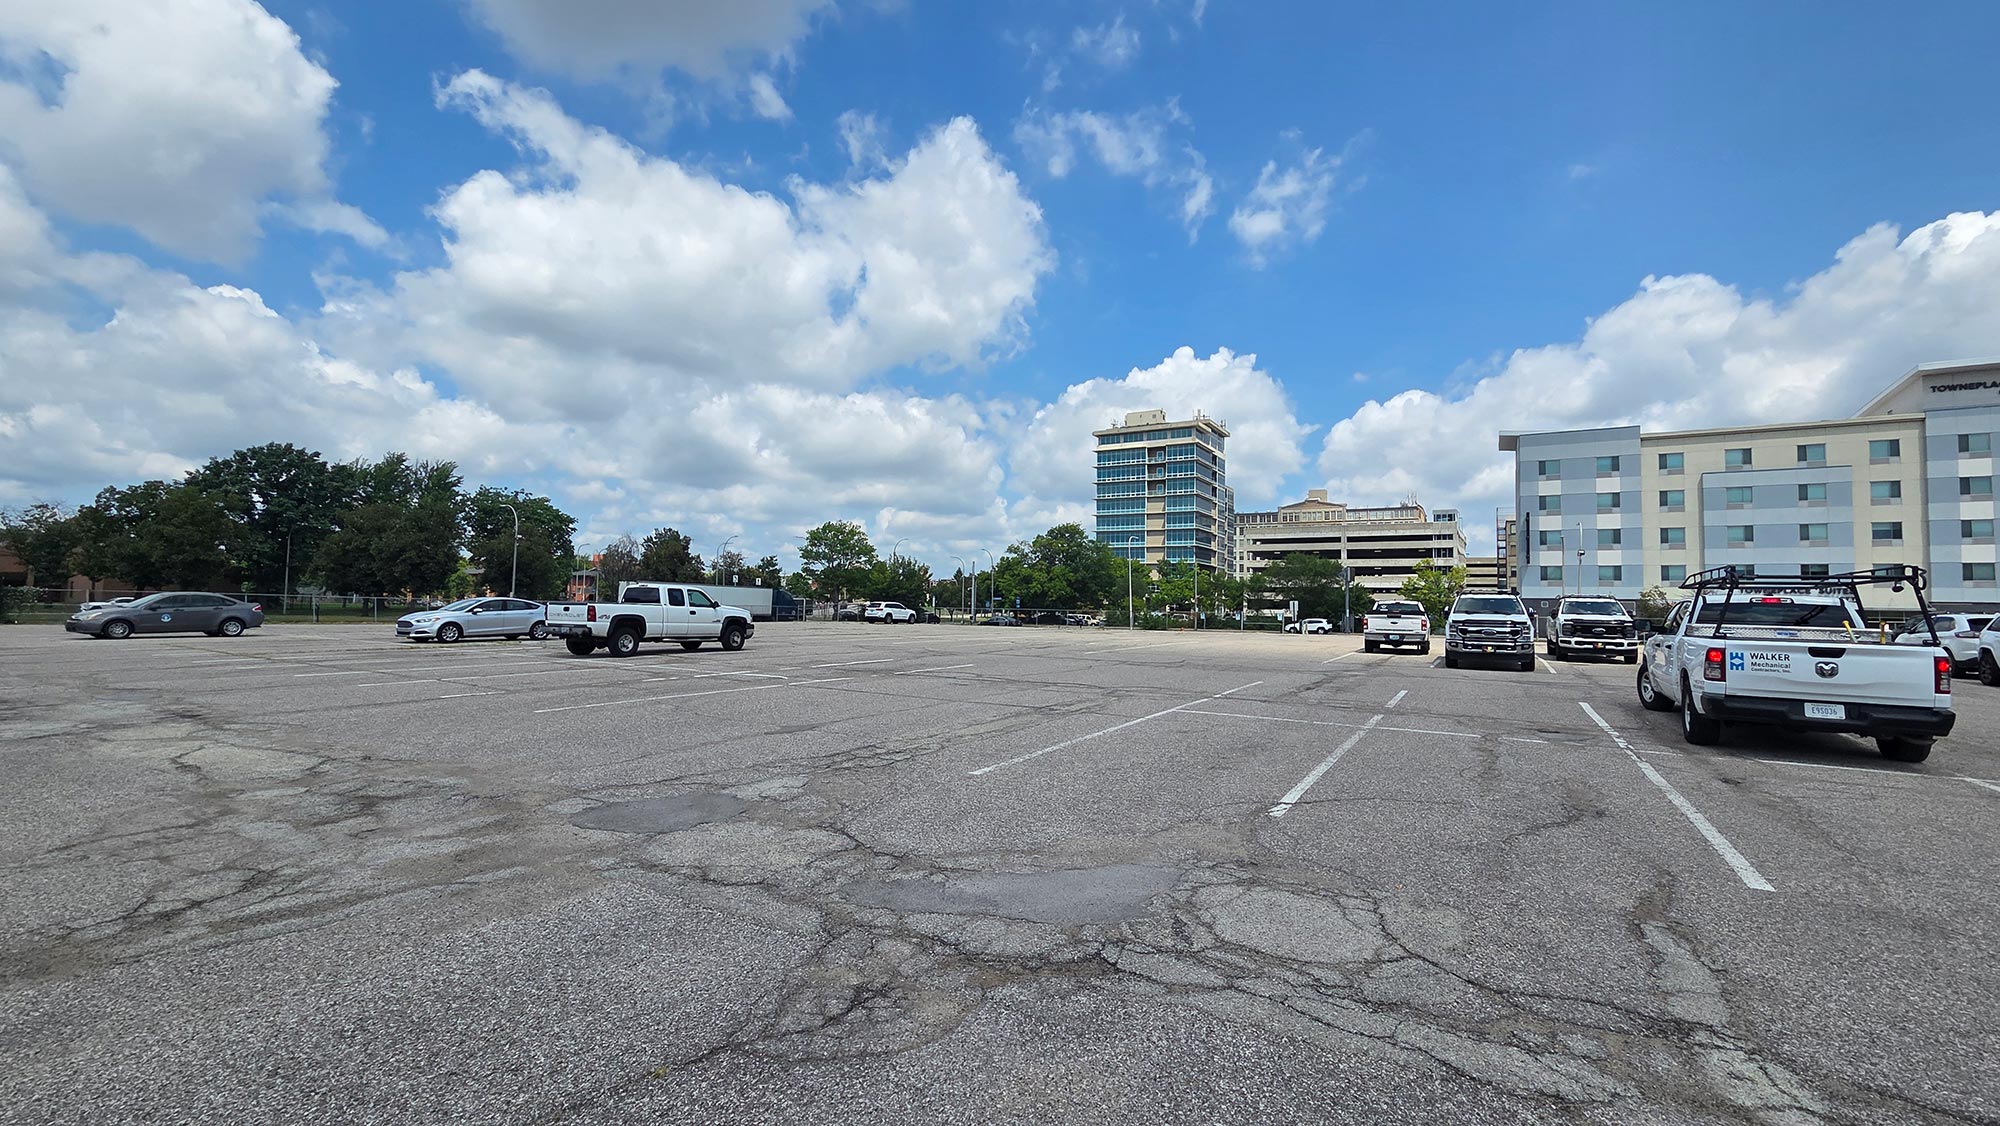
One benefit of this methodology is that it excludes some highly impervious but low population areas from the highest risk tracts, such as the airport and fairgrounds, which tend to rank high otherwise. This provides results that highlight where tree plantings and changes to land-use are most needed. In the case of Louisville, this is primarily in the urban core. Neighborhoods on the periphery of downtown are some of the most at risk due to the factors mentioned earlier: higher population densities, higher number of older/disabled populations, high amount of impervious surfaces (usually expressways and surface lots), and small amounts of tree cover.
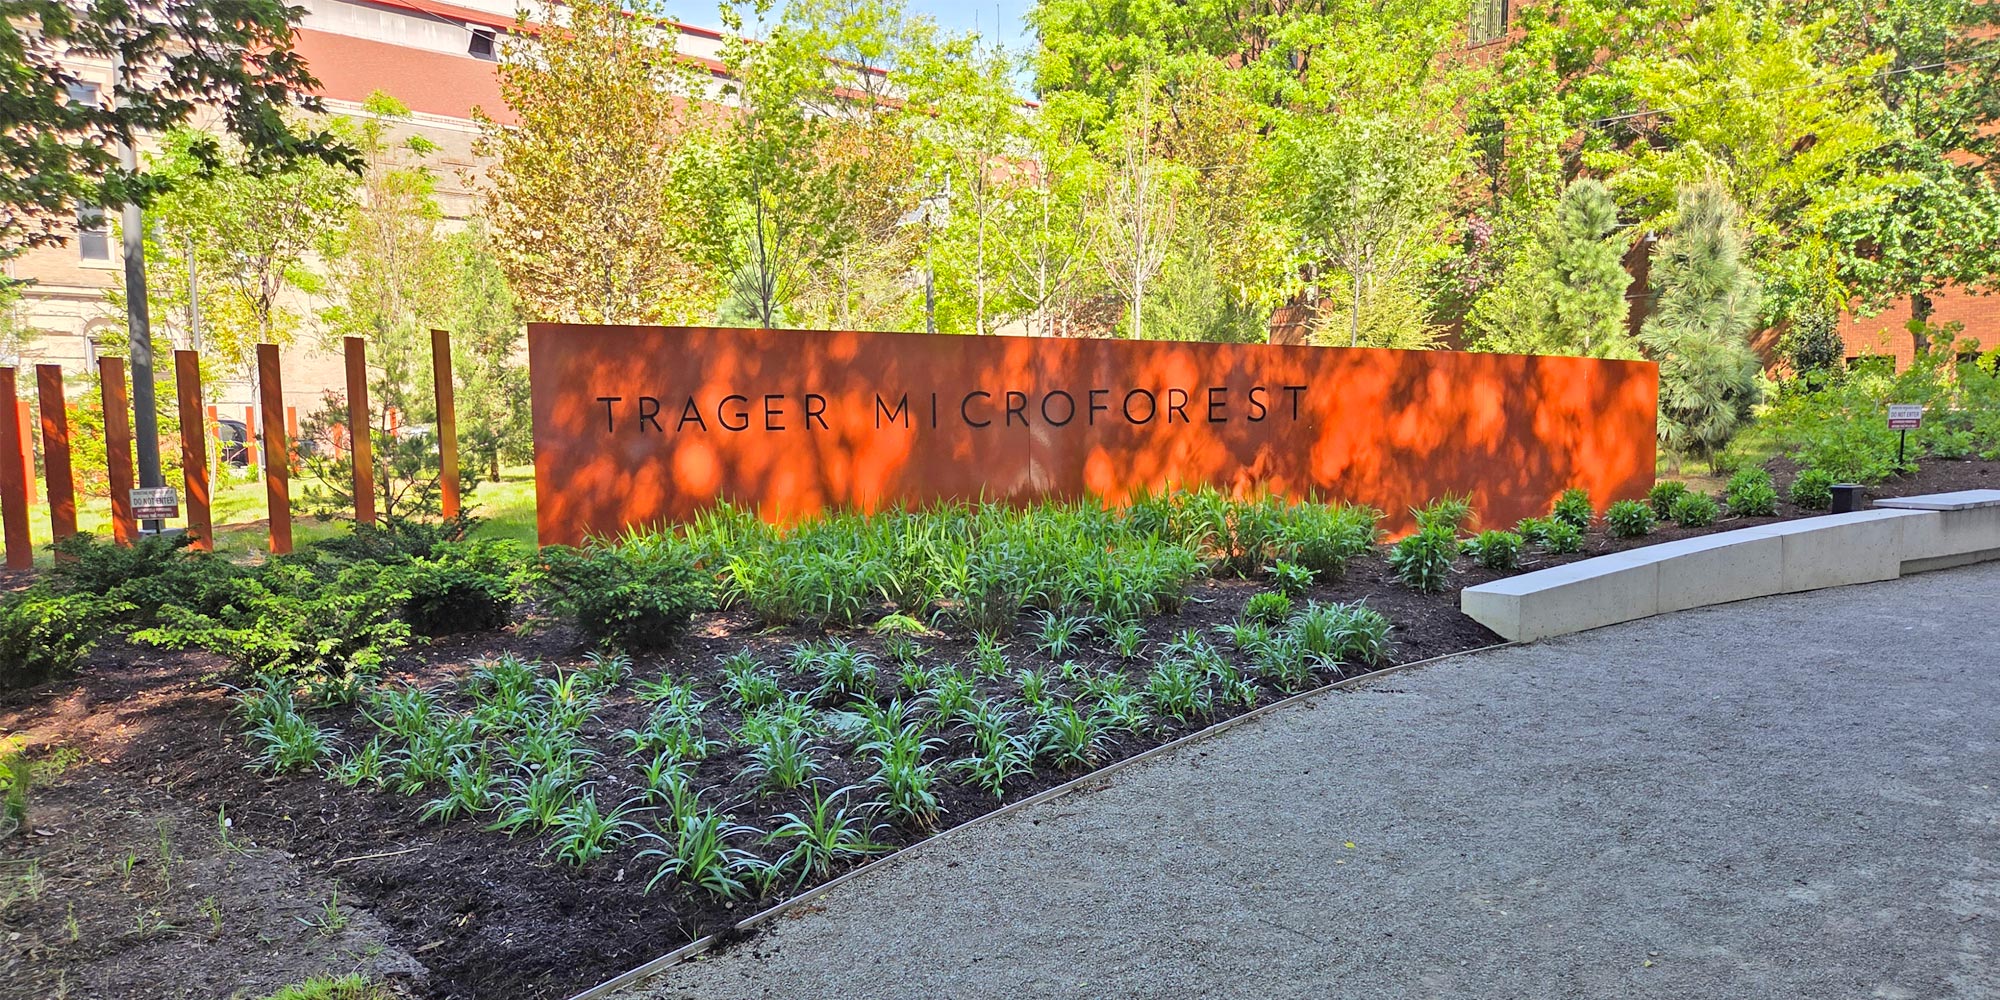
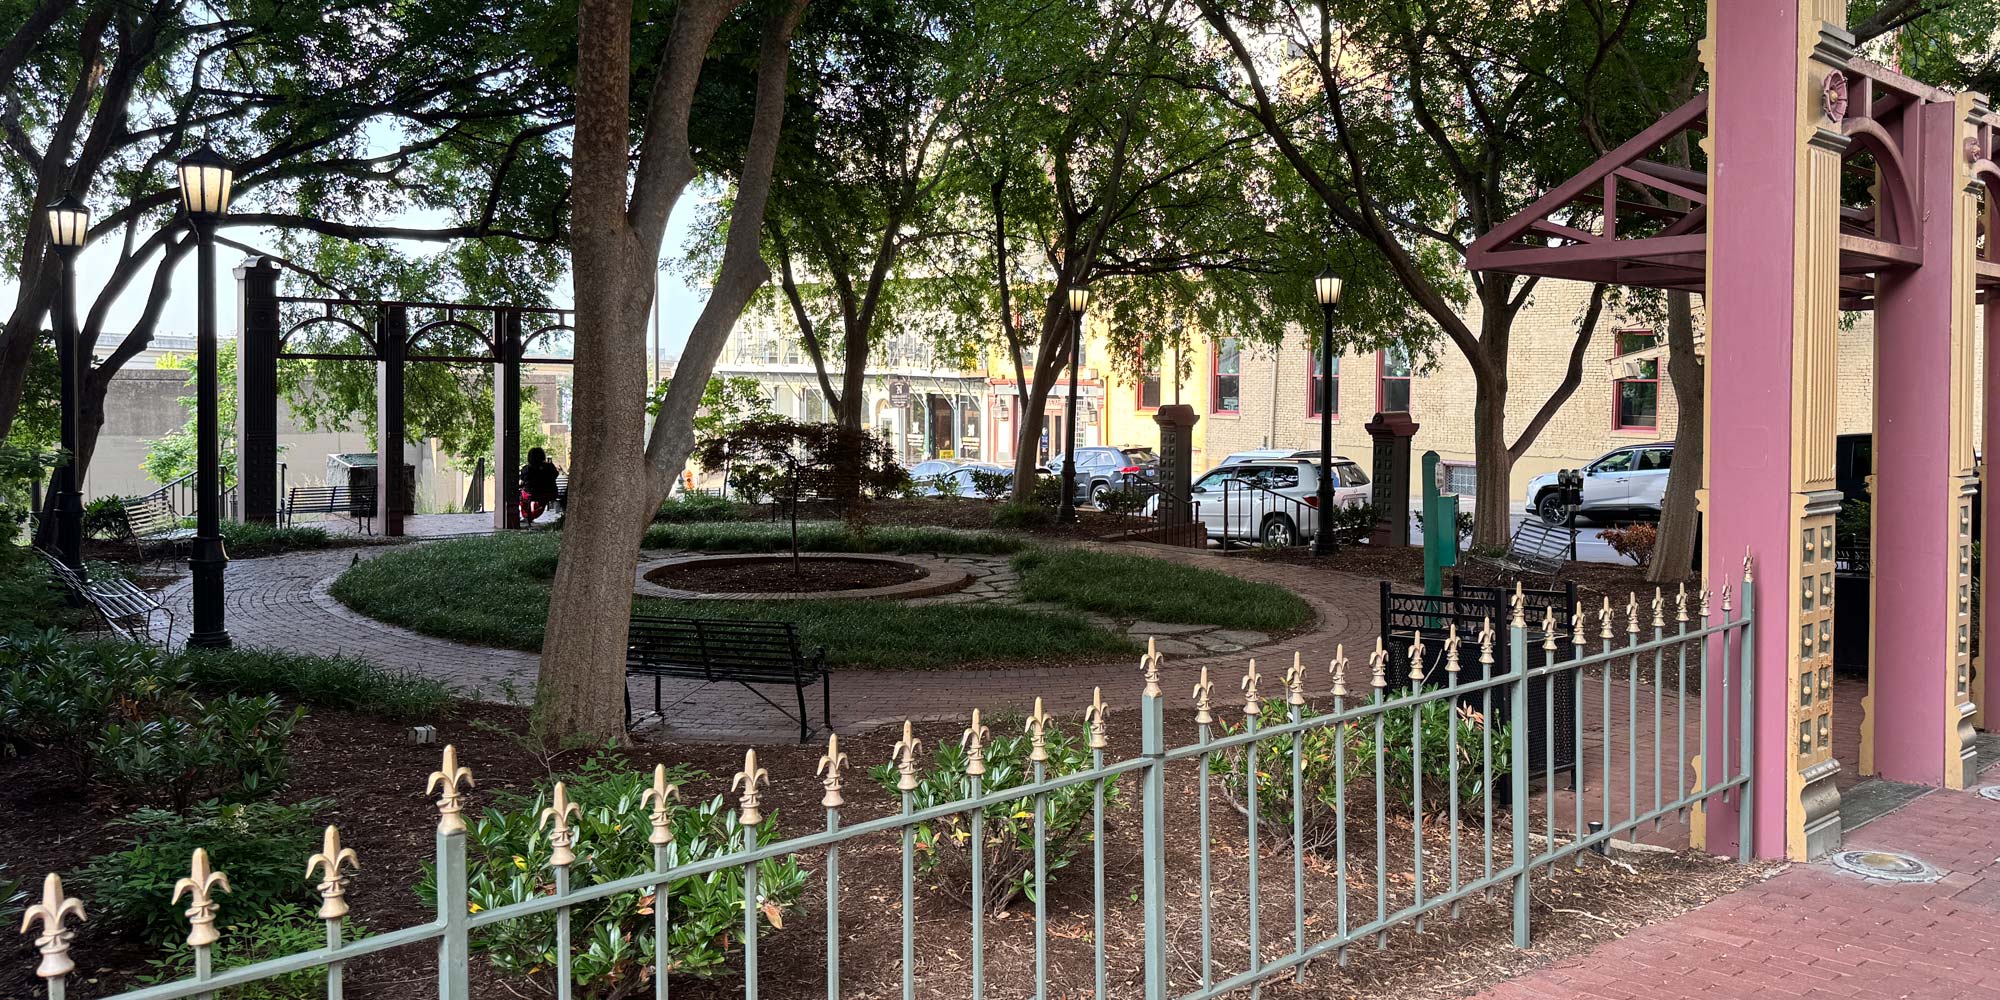
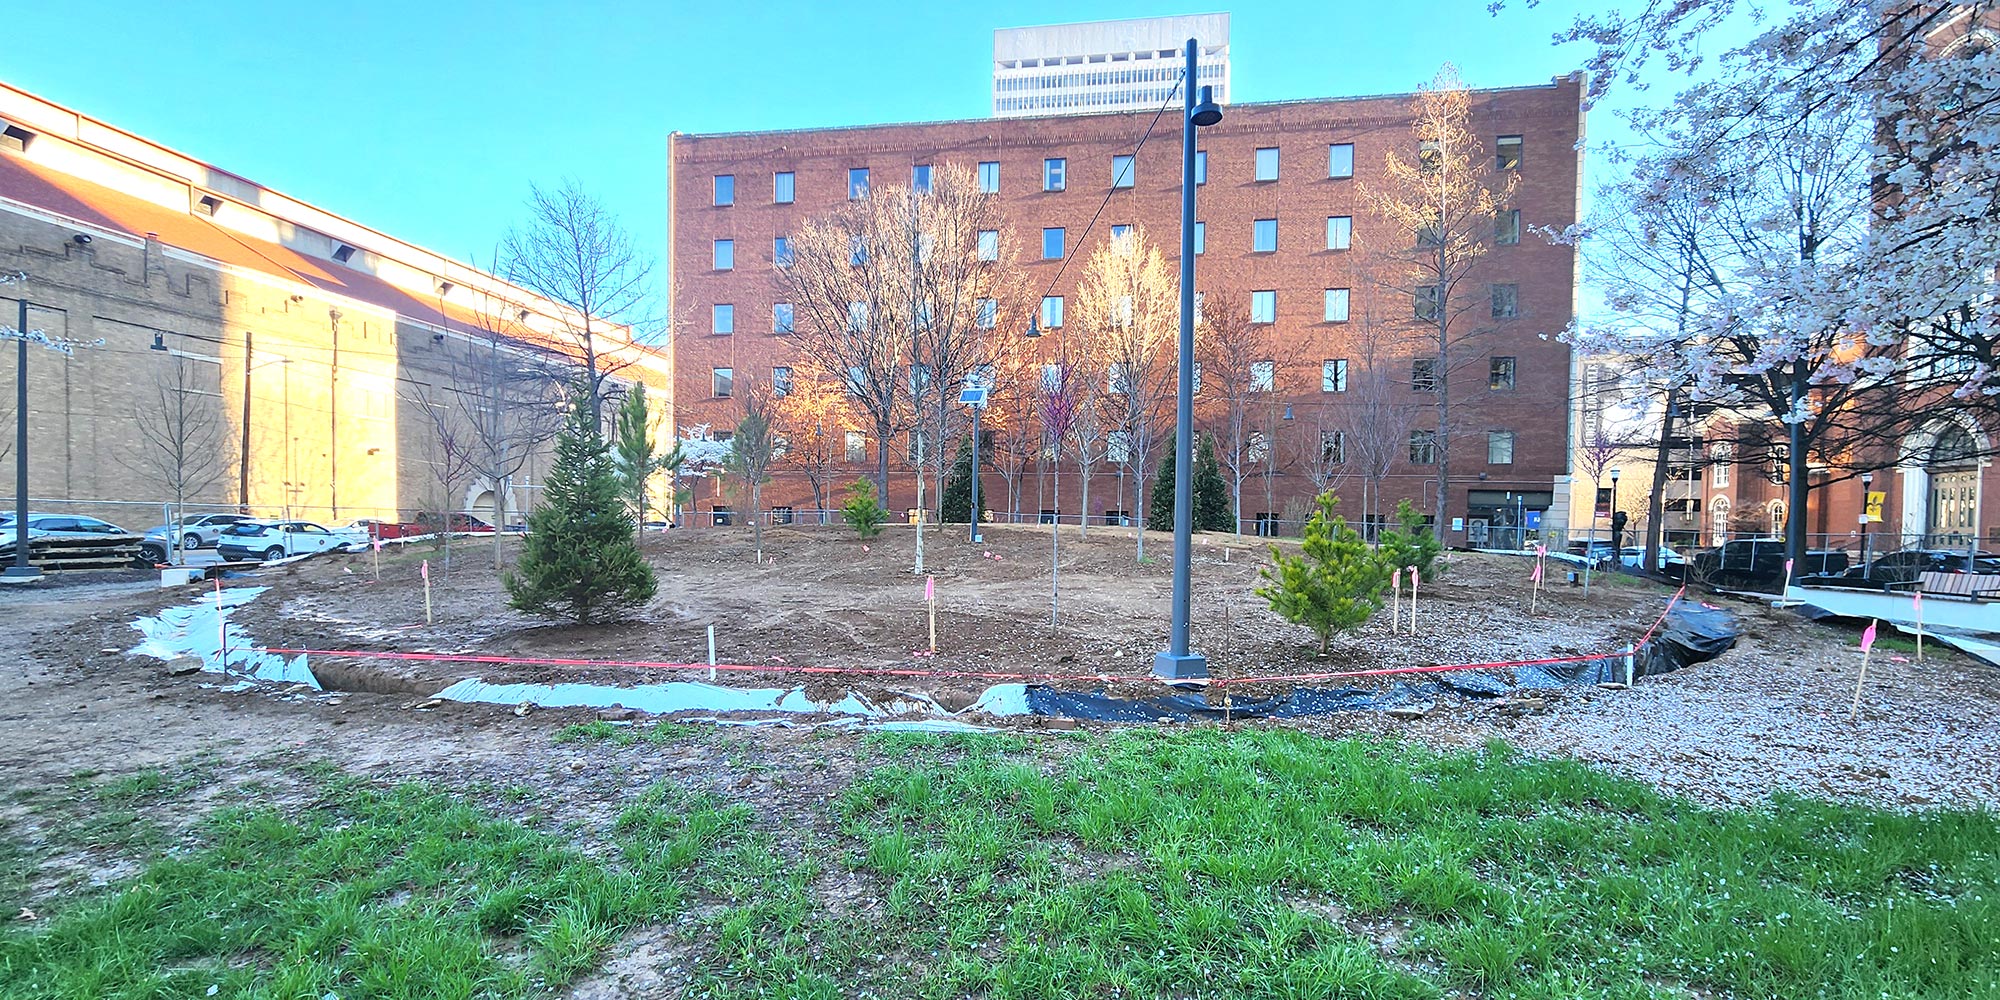
While this tool is useful on its own, it is especially useful within the context of our Greenprint program. Greenprint seeks to use an evidence based approach to build a greener, more sustainable urban core in Louisville. Many of the tracts that rank high in heat risk in this index are within the study area of Greenprint, so there is hope for significant improvements in the coming years. In addition, local organizations such as TreesLouisville and Metro Urban Forestry have put substantial effort into greening these areas, although the fruits of their labor may not be evident for a few years as trees mature.