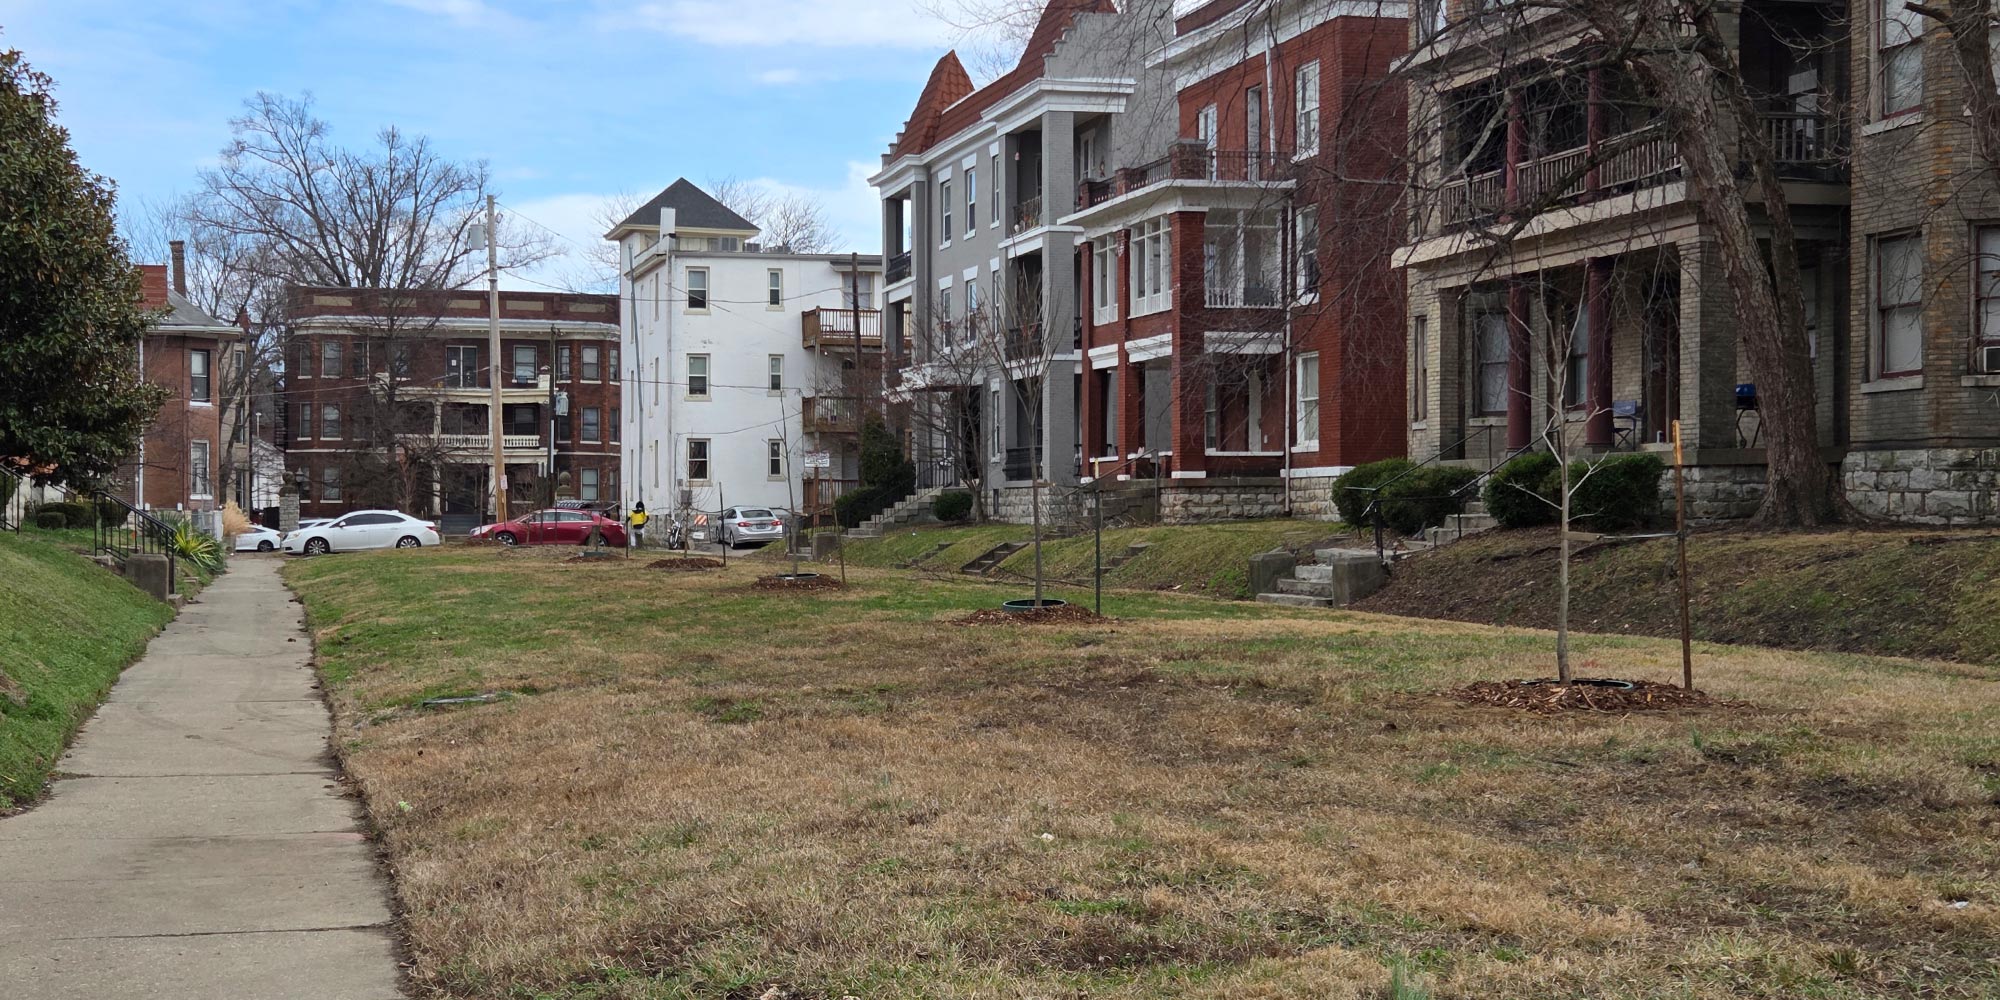
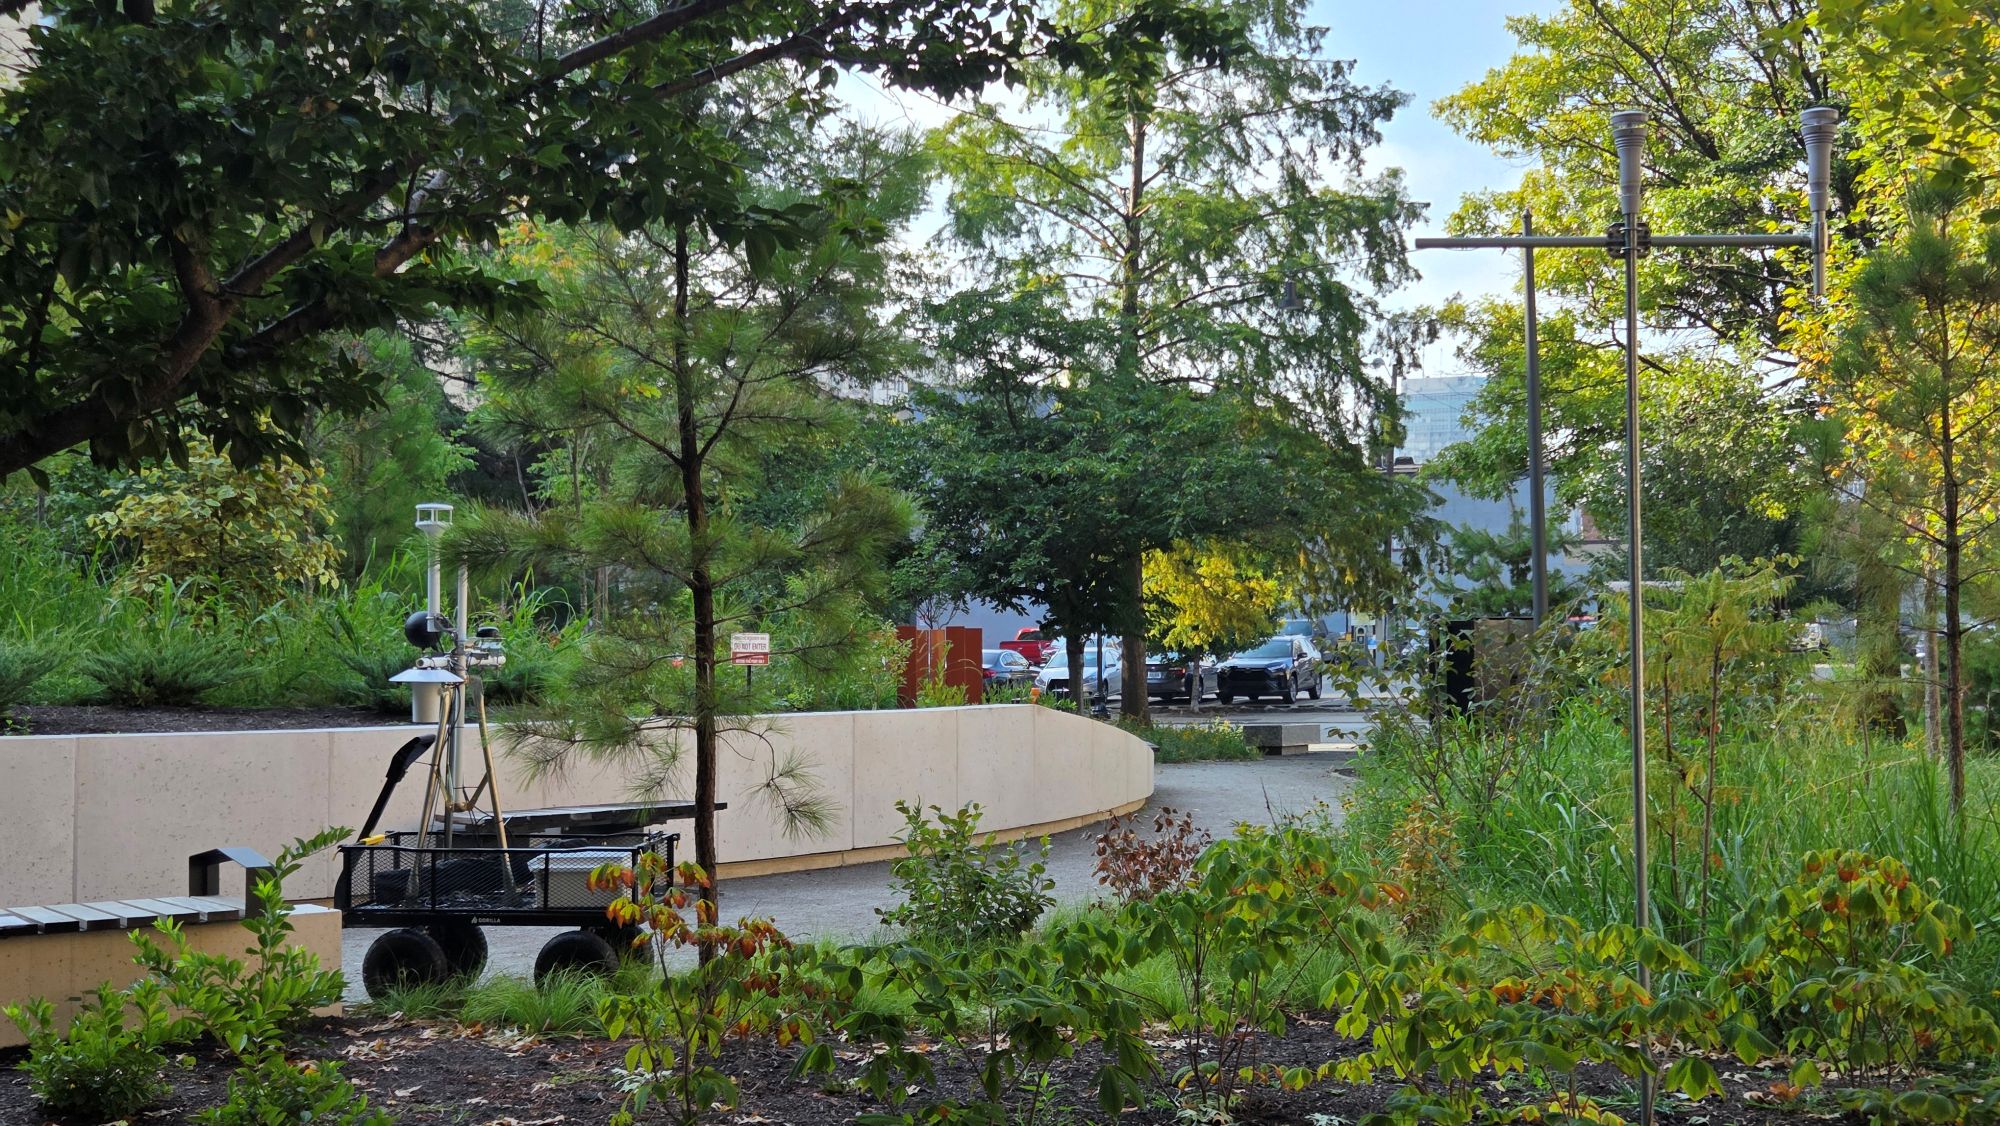
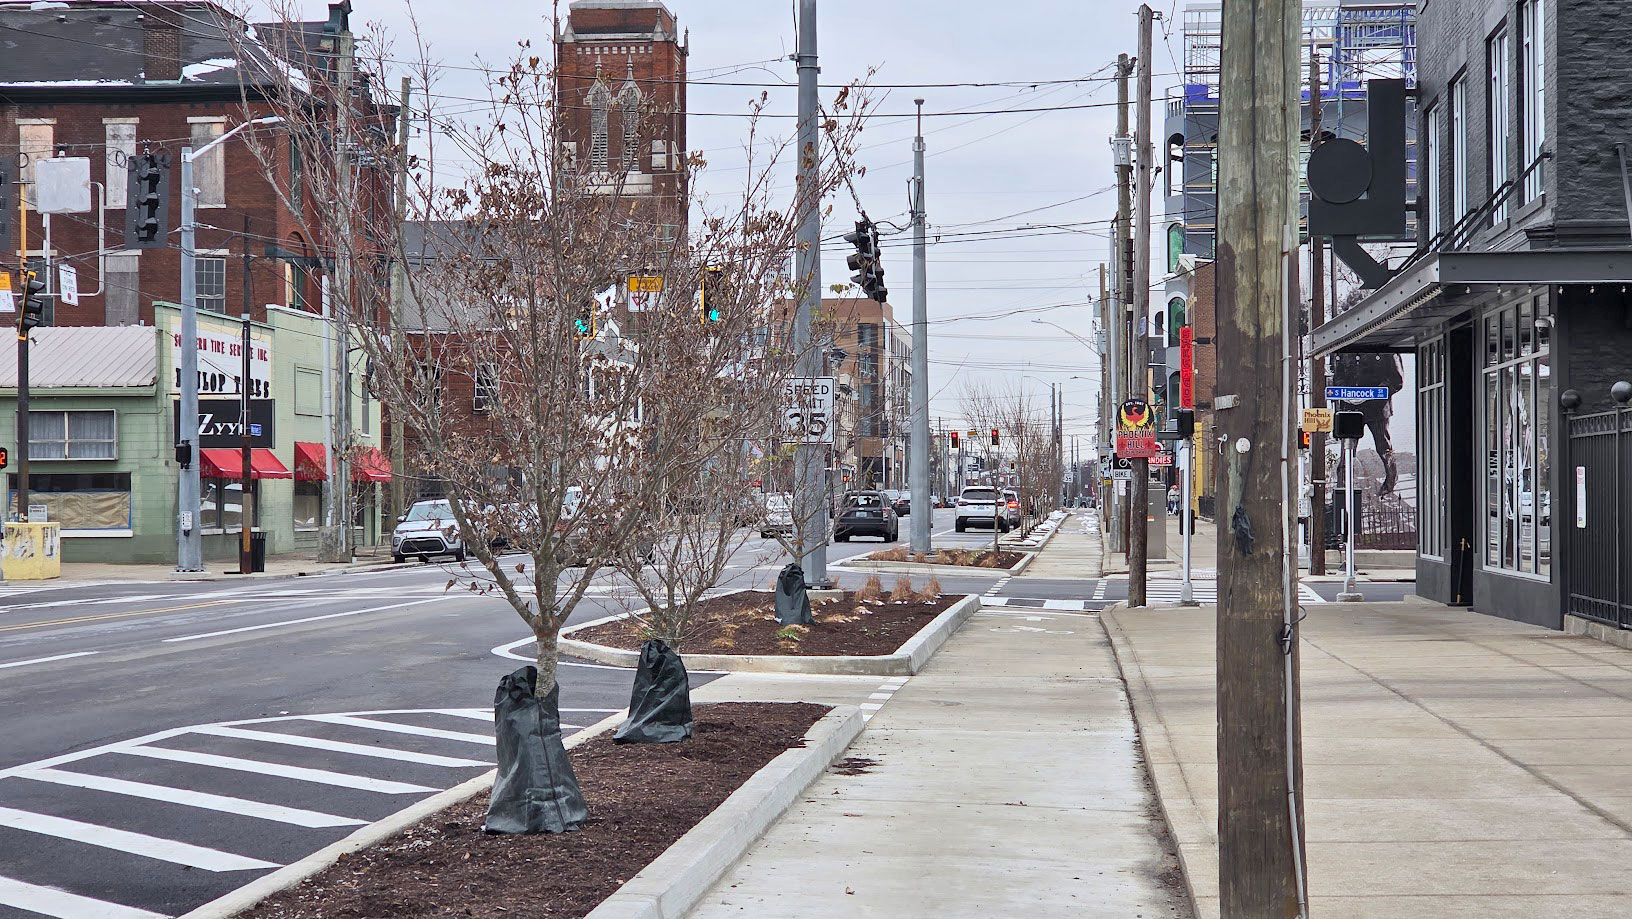
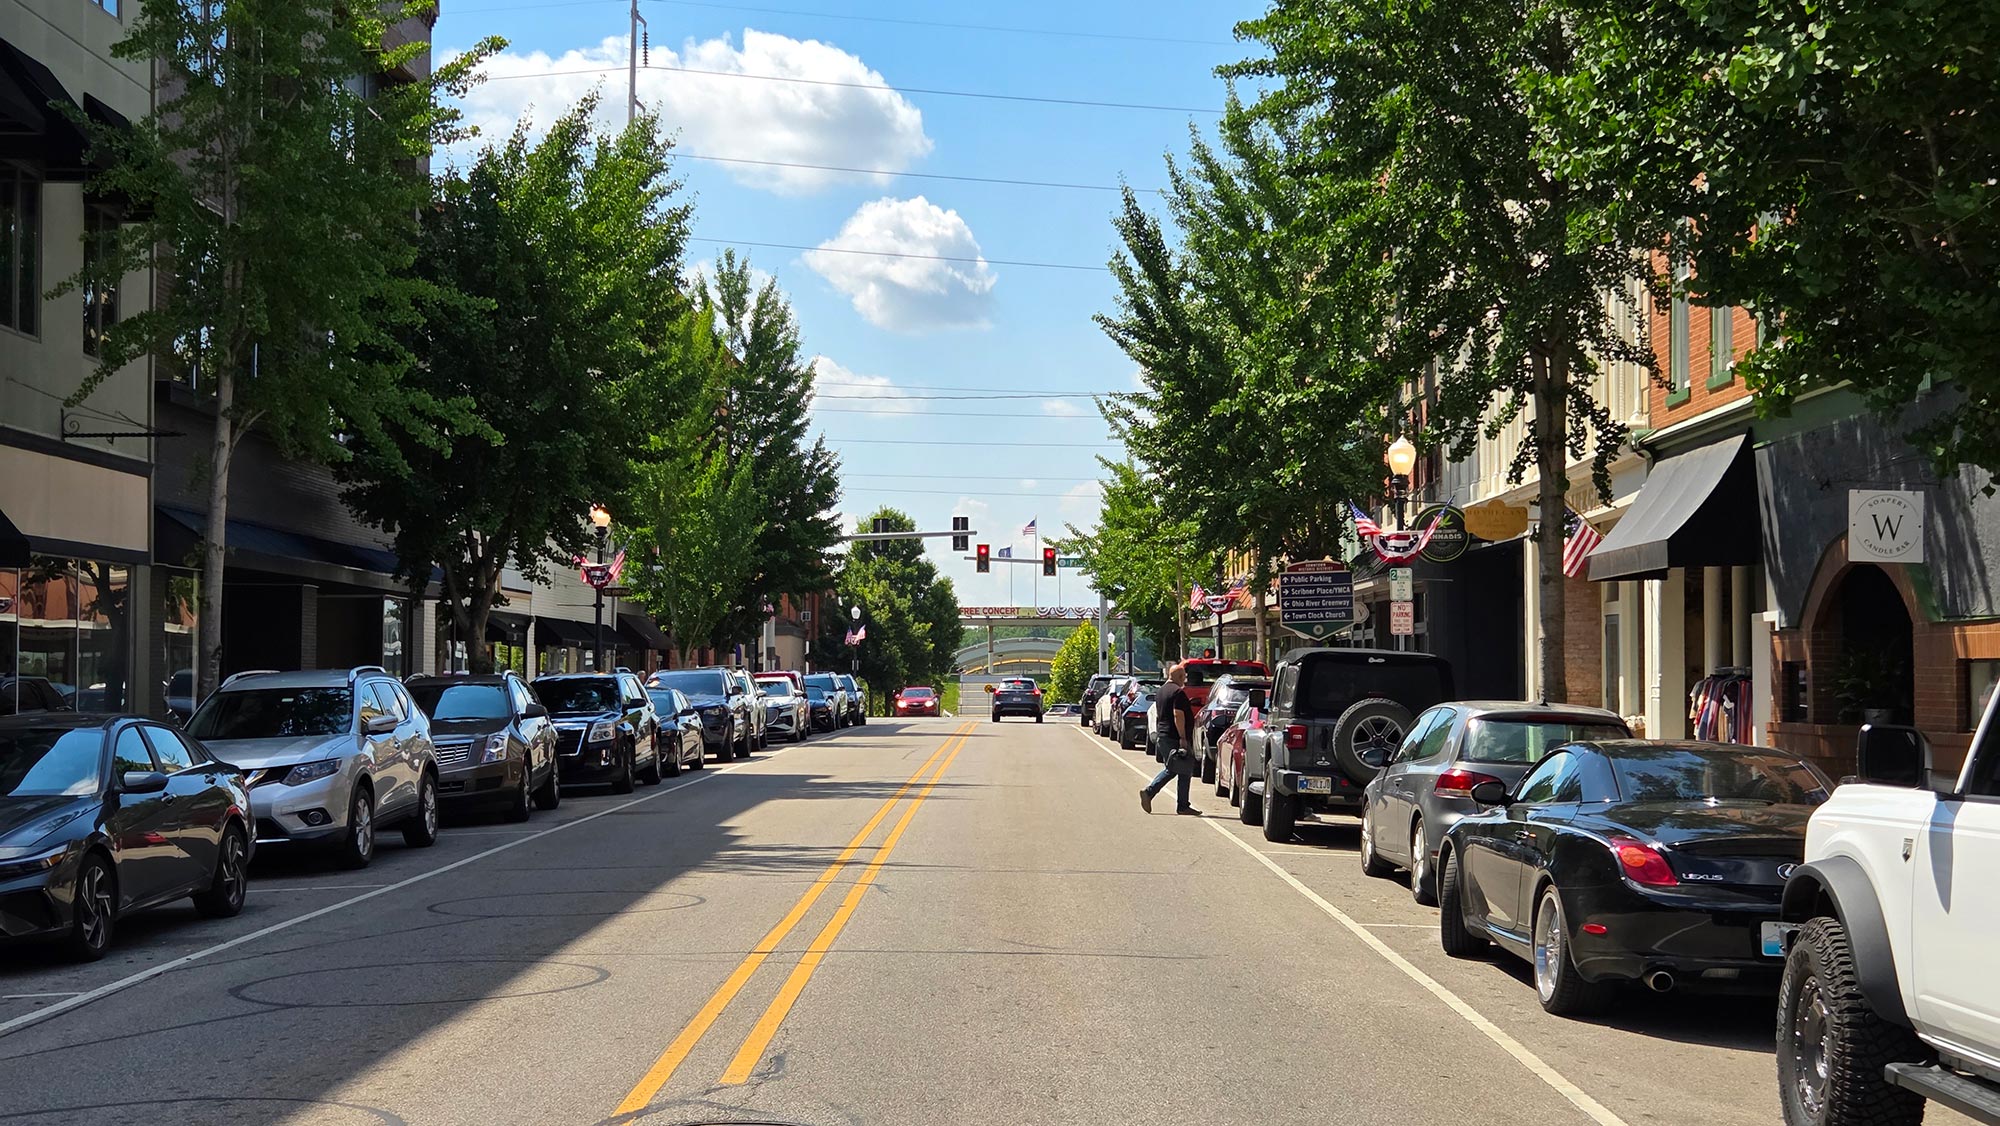
Presence of greenery is pivotal for the safety of all road users. Pedestrians and cyclists need it for shade, cooling, separation from vehicles, and to absorb pollutants. For drivers, the same greenery can keep glare out of their eyes, lower rates of speeding, and help fight potholes. This all makes the planting of street trees important for Louisville’s major road corridors, but many of our roadways may lack nearby greenery, creating a dreary gray environment that makes all road users more prone to a litany of hazards from heat stroke to car crashes.
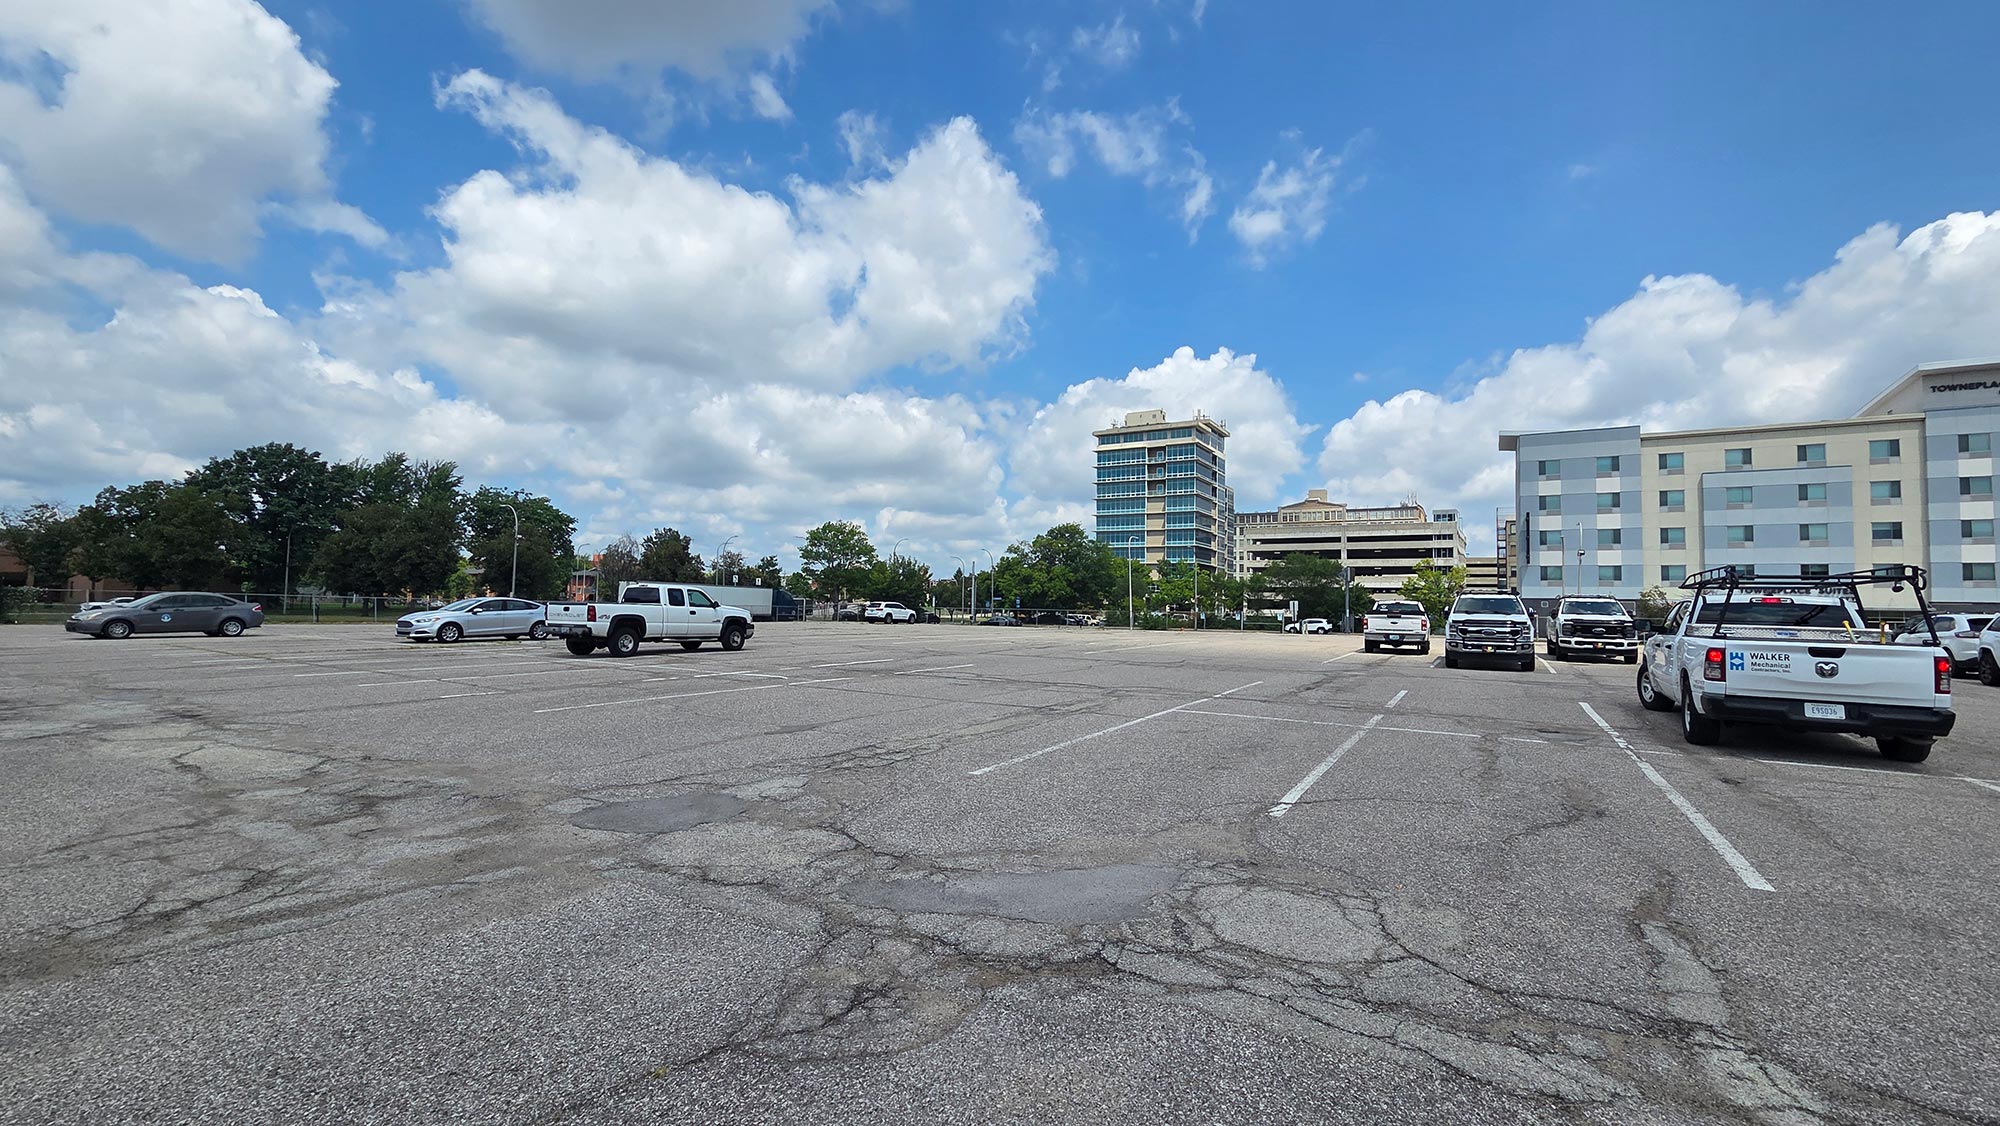
Luckily, data exists that allows us to take a look at Louisville’s major road corridors and identify the ones that are the most “gray”. In this scenario, a gray corridor would be one where the built environment is dominated by impervious surfaces. Gray corridors are full of parking lots, wide roads, and buildings with minimal tree canopy cover to offset the urban heat, environmental pollution, and other negative effects that pavement can produce.
First, we need to qualify what makes a roadway corridor relevant for analysis. KYTC’s traffic data can tell you average daily traffic counts for many of Louisville’s roadways, which can be used to cut out roads with low traffic counts. The threshold of 20,000 daily vehicles is often used to consider roads for road diets, so thats a safe marker for what qualifies as major, relevant roadway but not many roadways in Louisville actually pass 20,000 daily vehicles so we will use 10,000. All streets under 1-mile long will also be cut, since small segments effectively produce a small sample size for land cover analysis and can skew results.
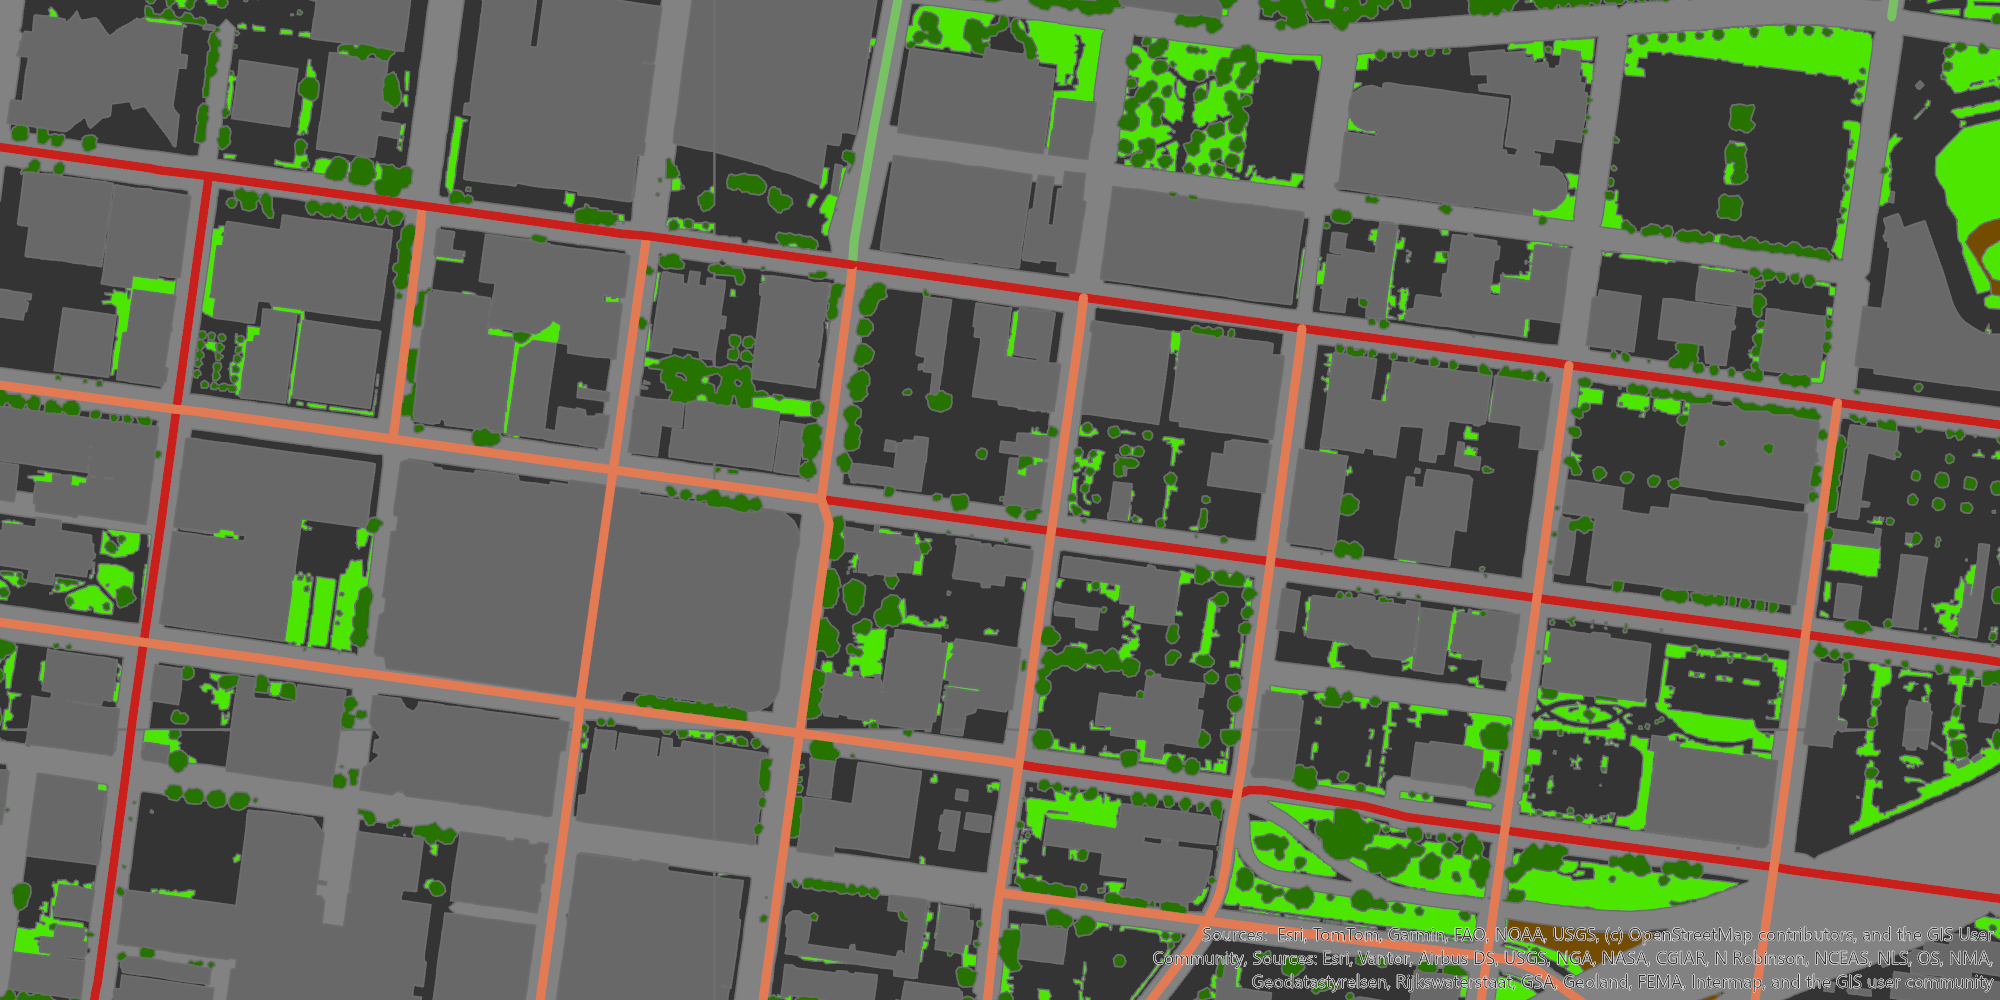
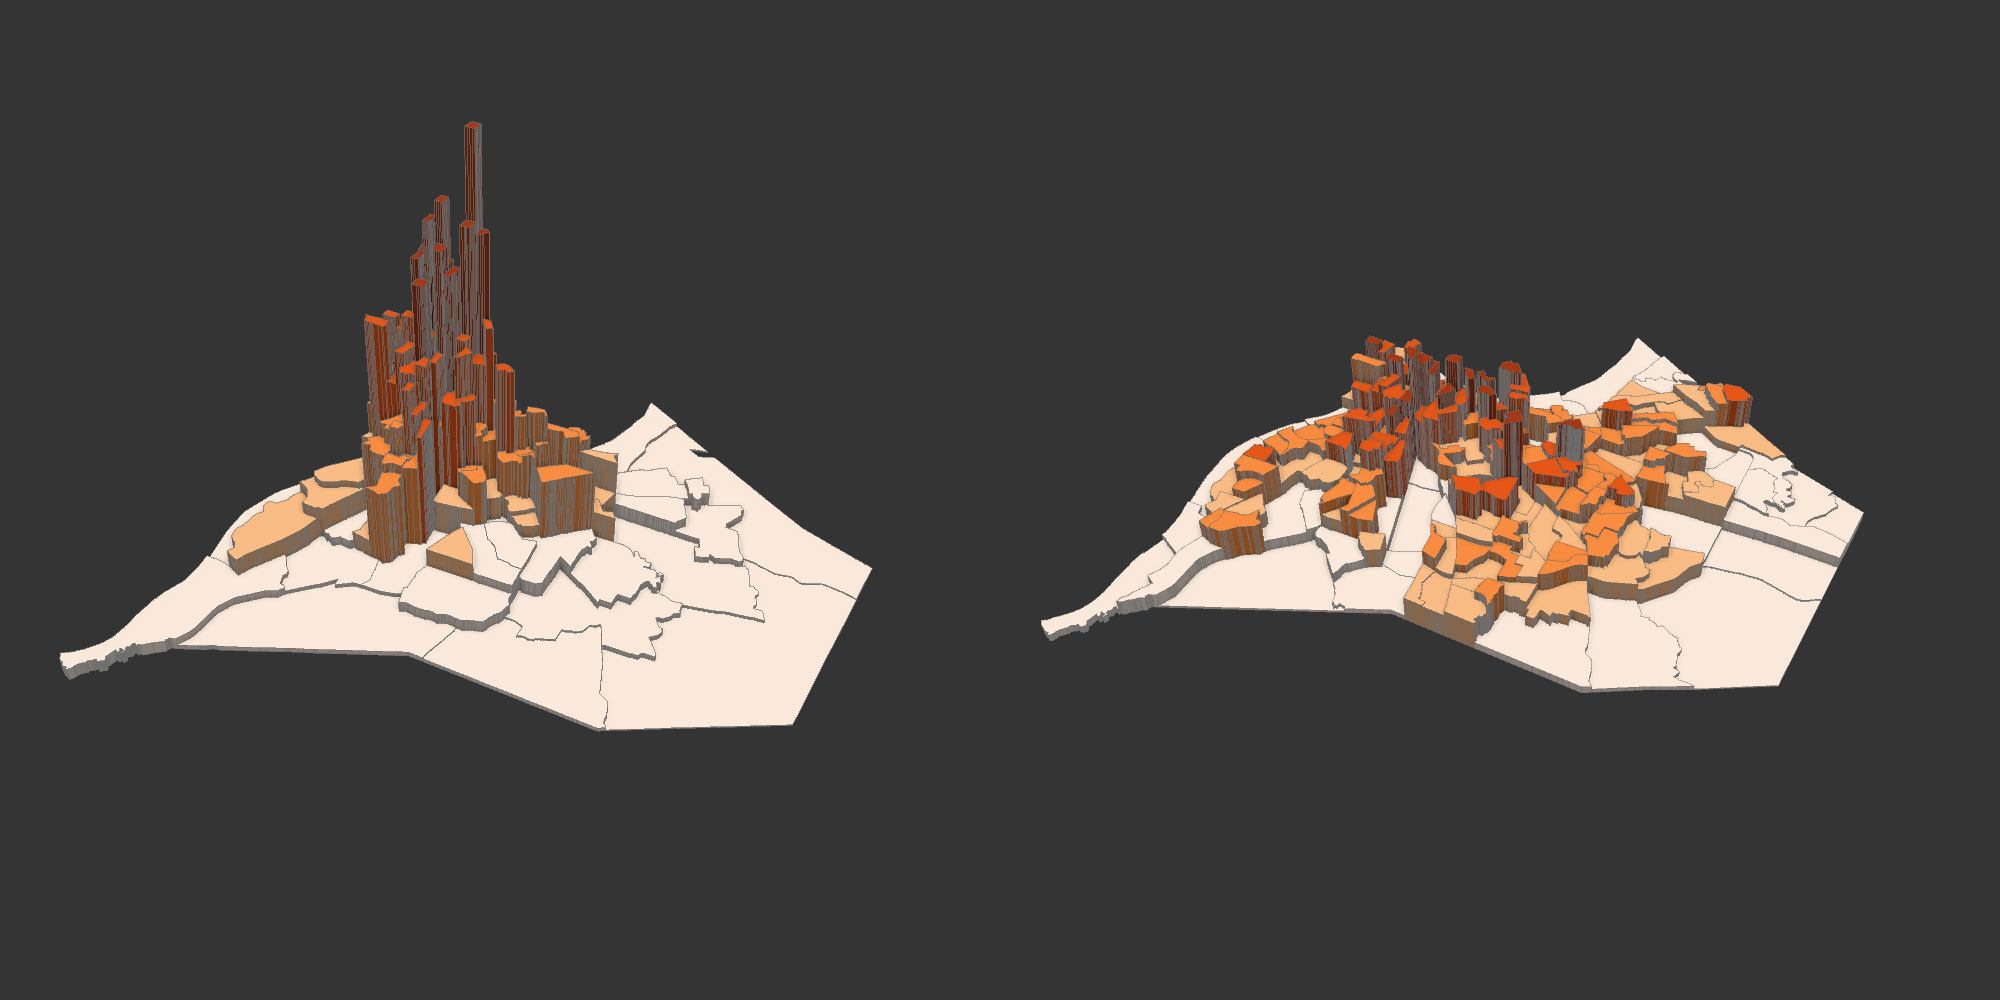
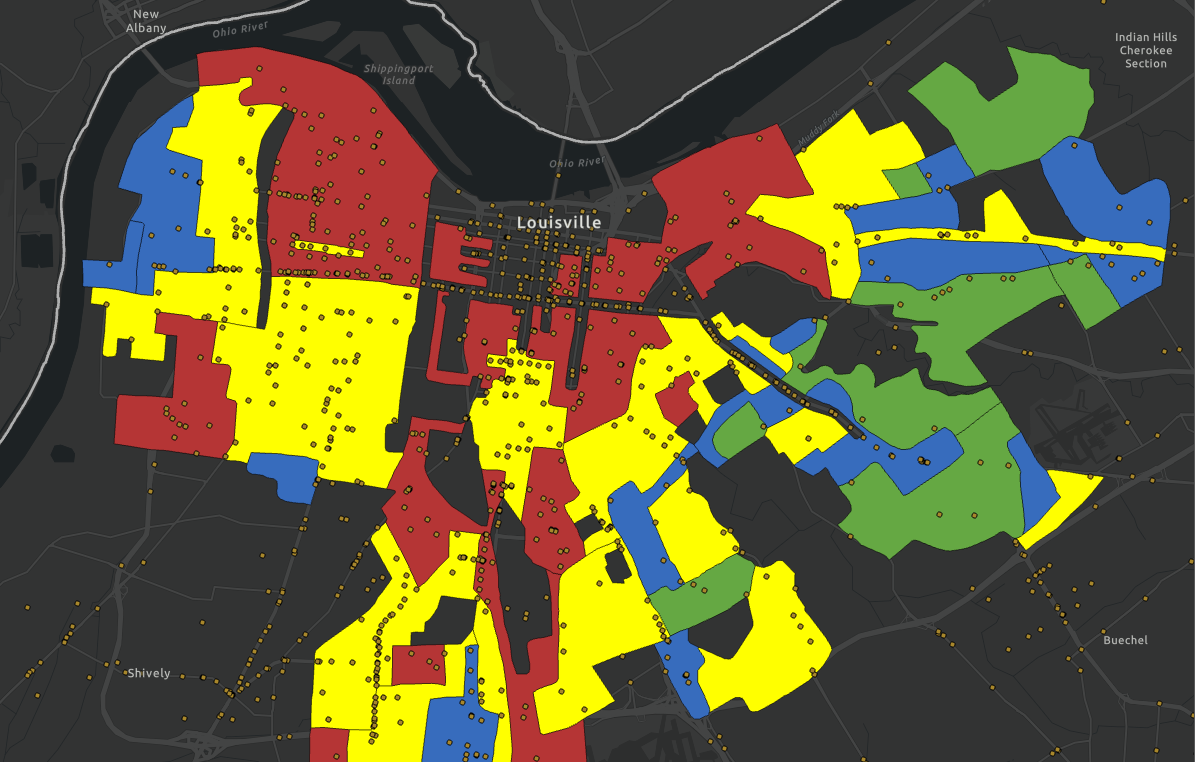
This cutting takes the total roadways from 1,001 to 257. Using this final road dataset, we can assess the land cover that makes up the 200-ft area around each road (this catches roads and usually one single-family home sized lot adjacent to them). All impervious surfaces and buildings were thrown together into one percentage value, which gives the “gray”ness value for each roadway. The same methodology can be done with tree canopy coverage as well, so you can also see which corridors are the most green. The web app below shows a map of the grayest corridors, a ranking of each corridor by grayness, and some other relevant information.
Click here to open the below map in a separate window.
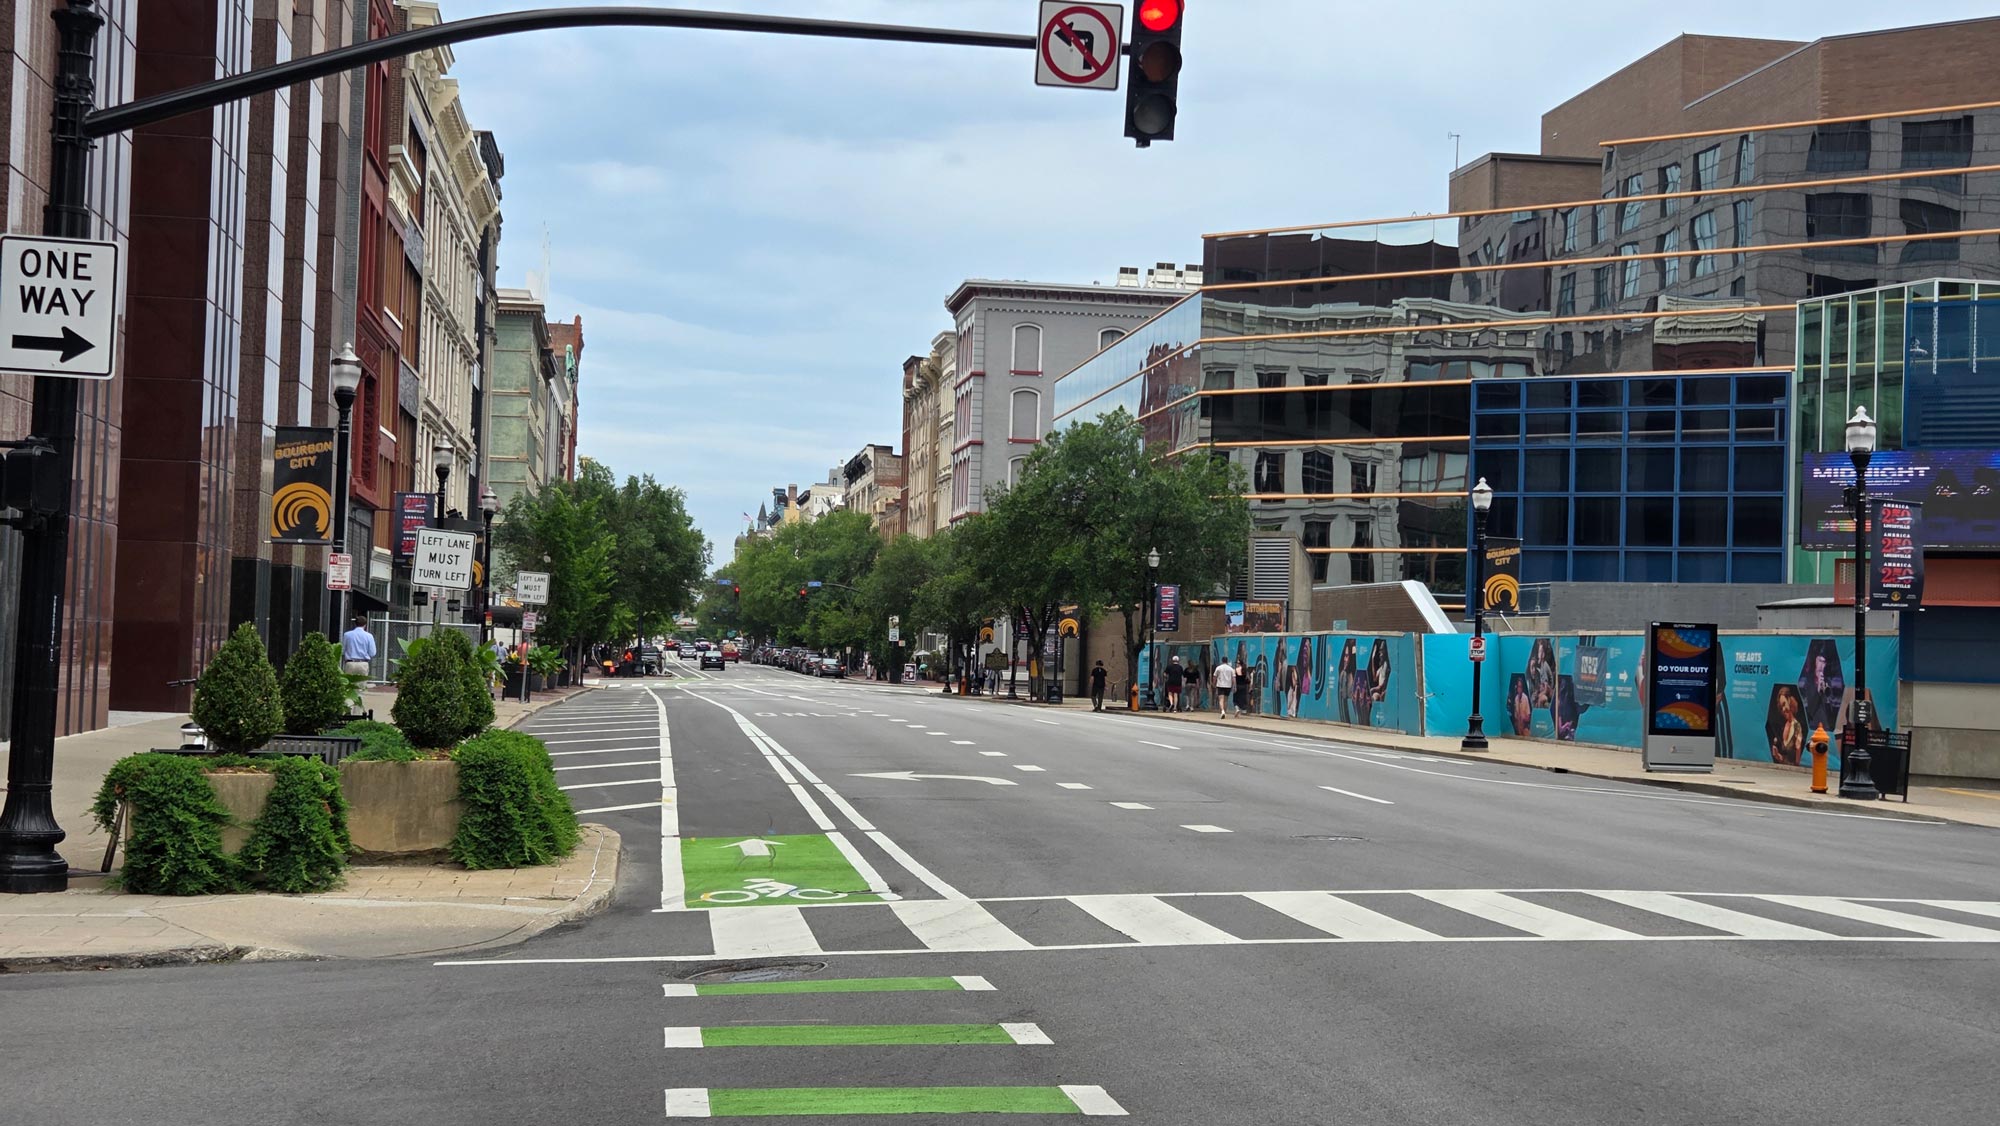
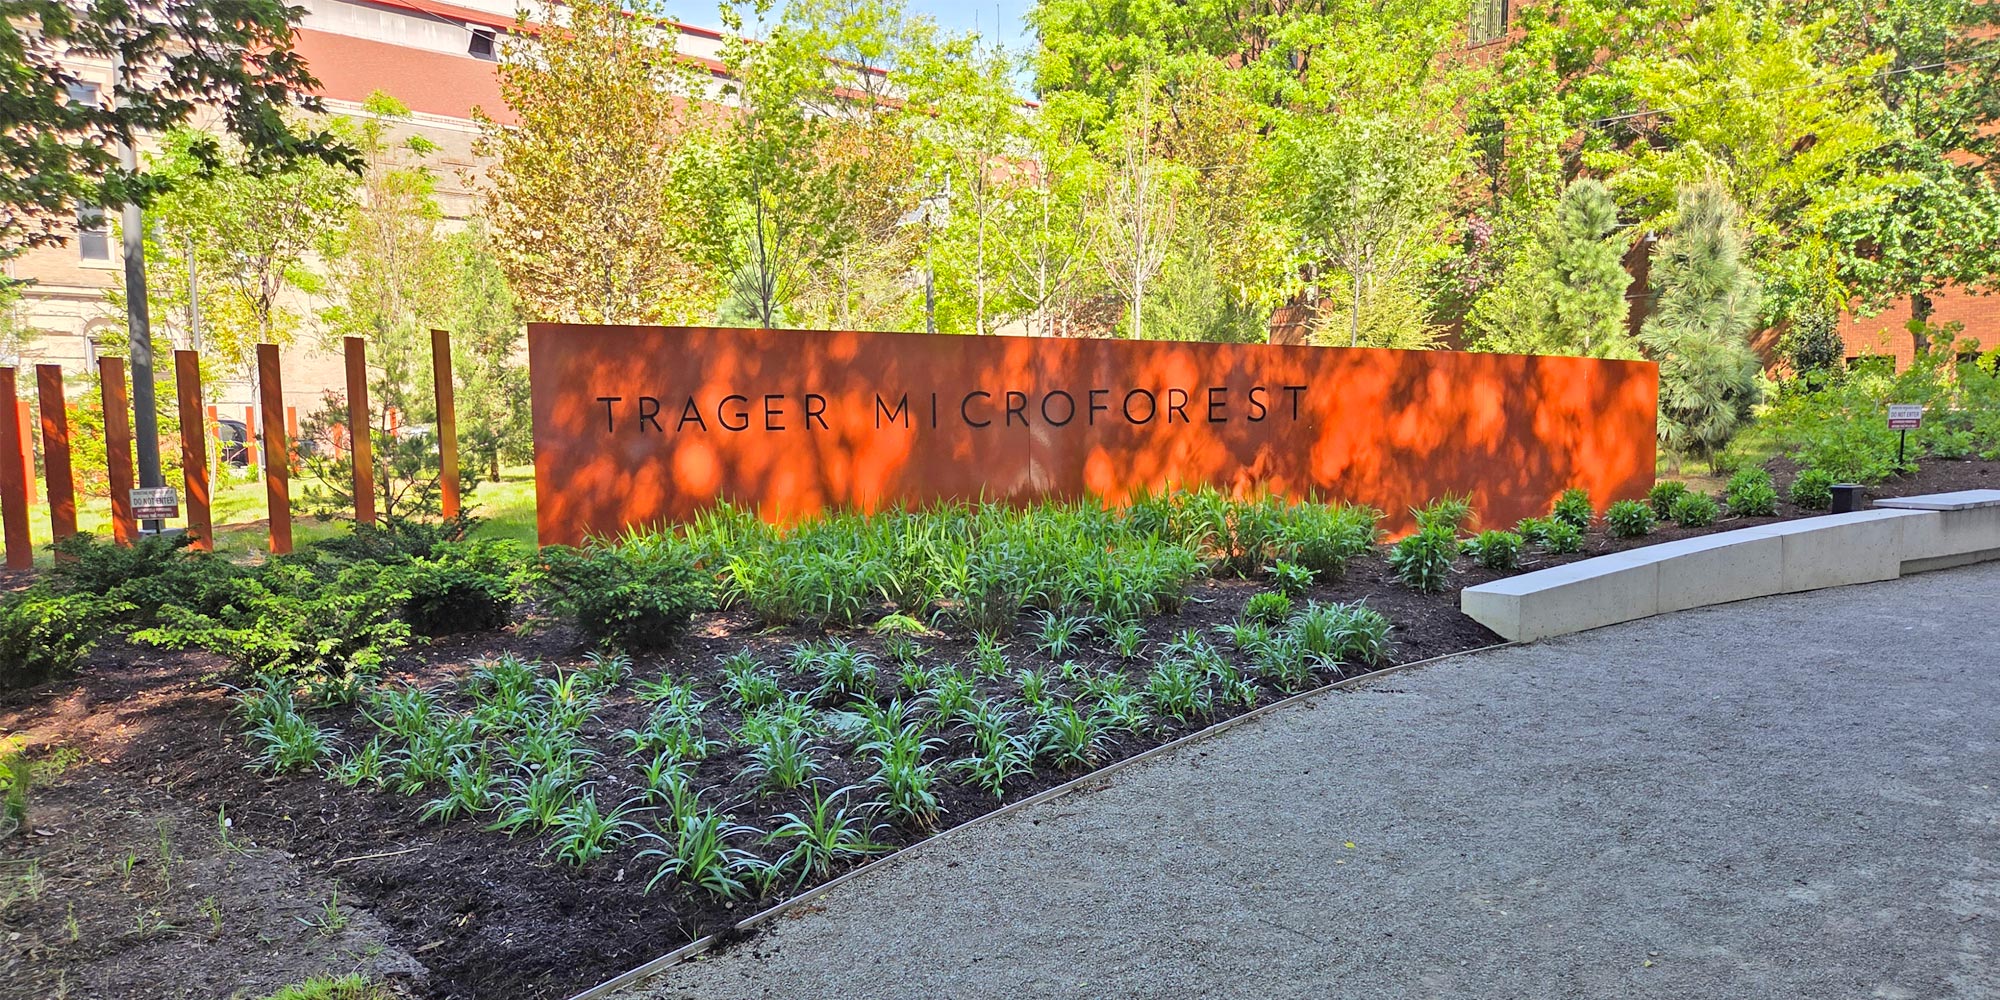
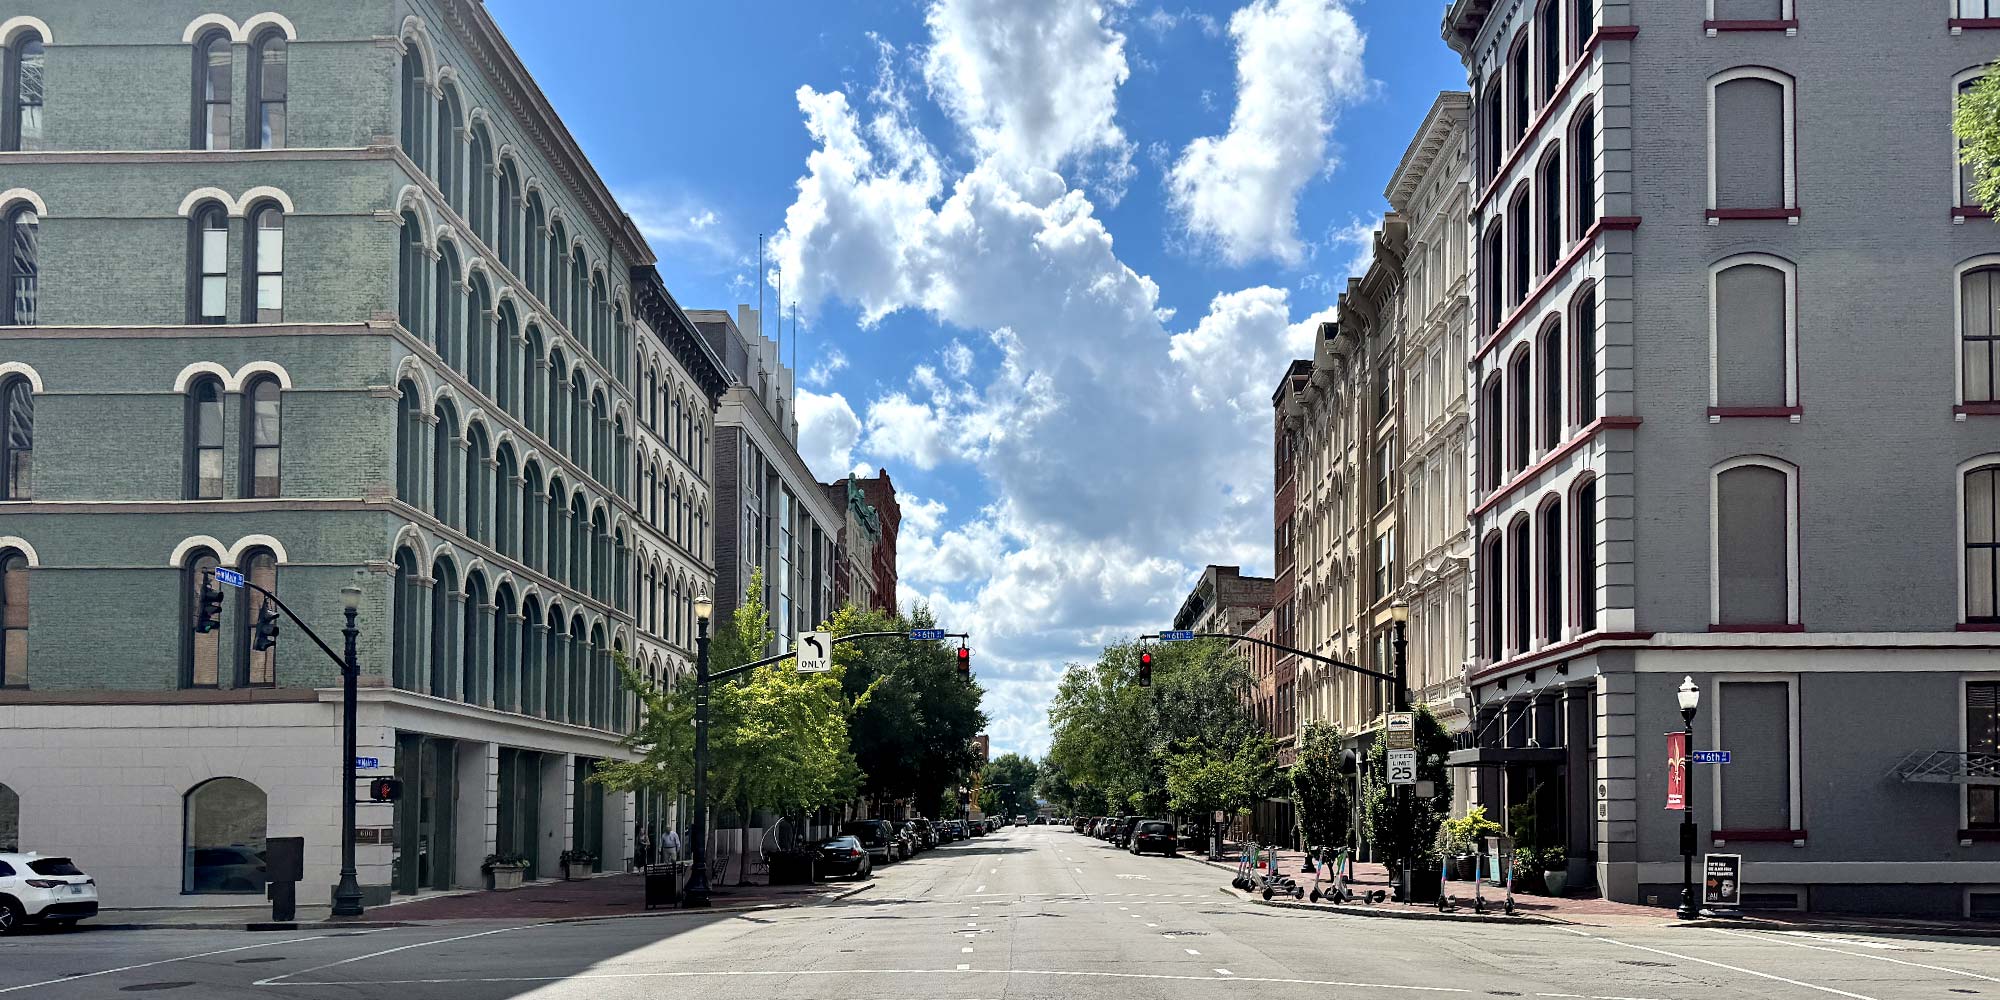
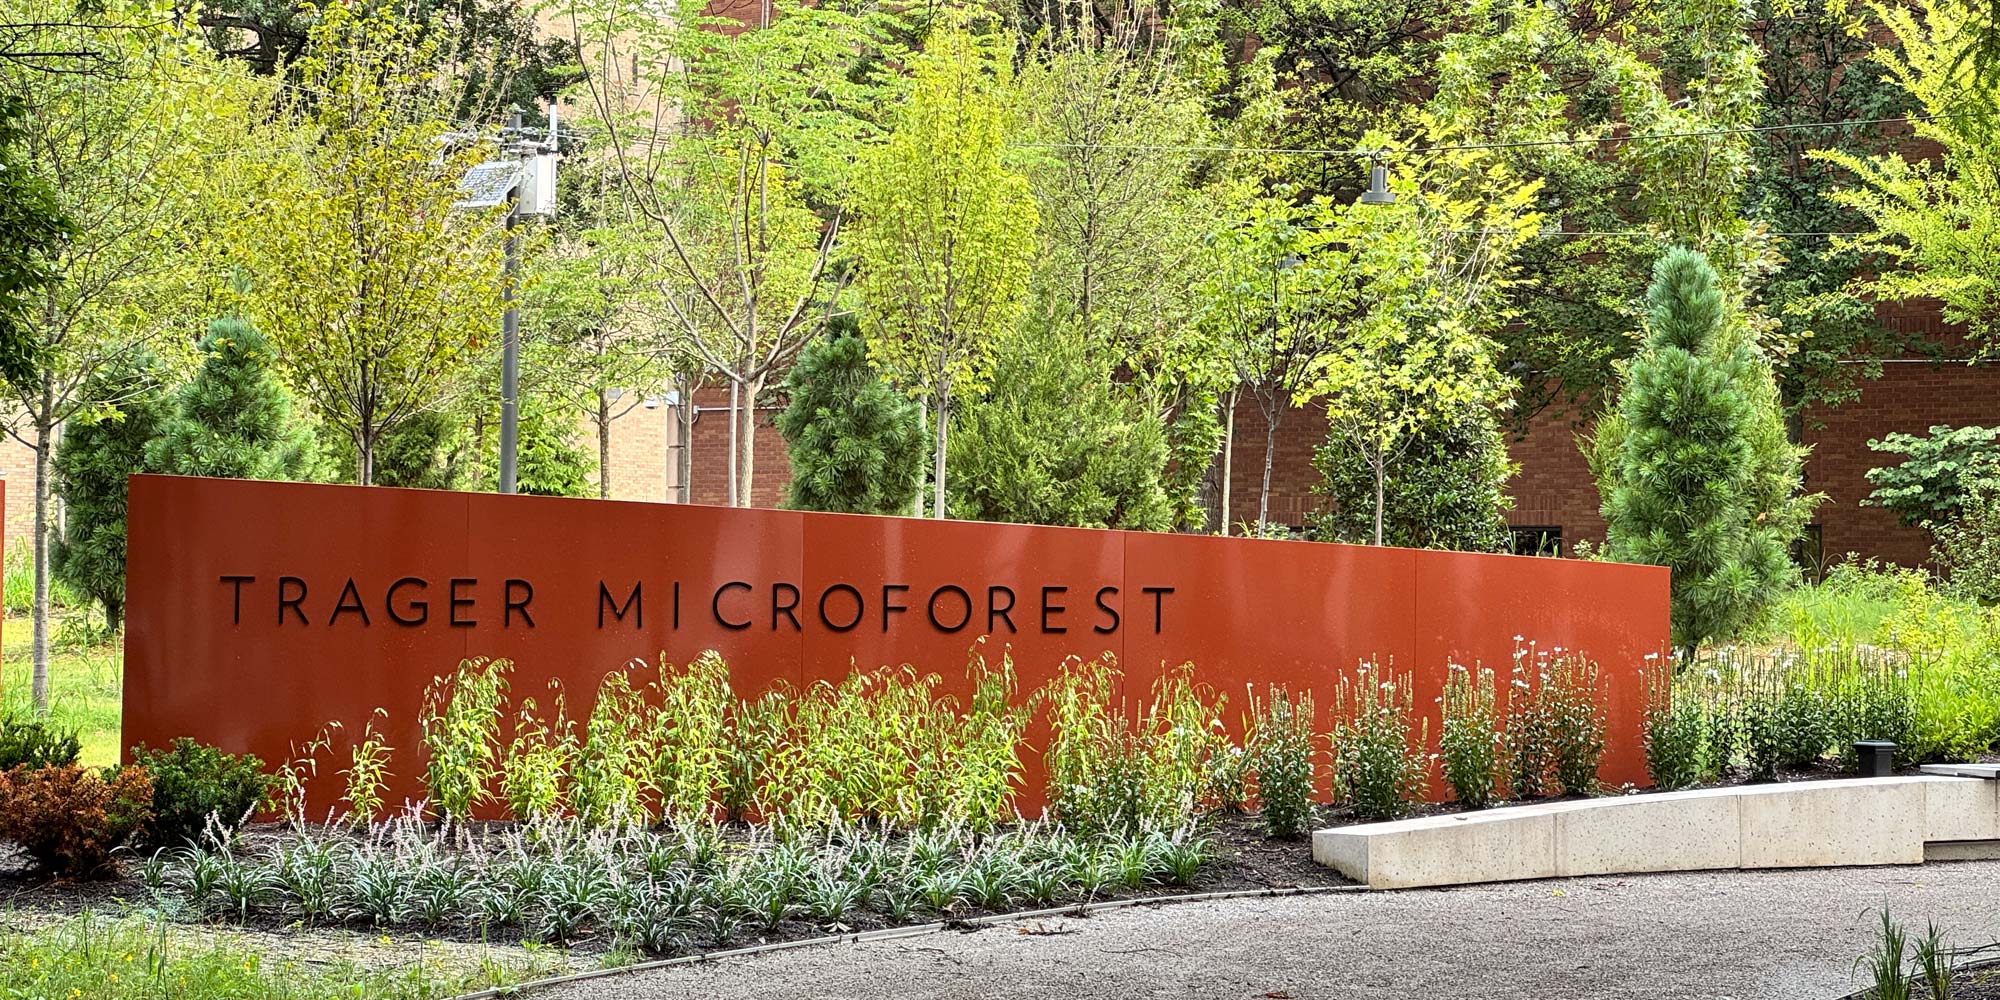
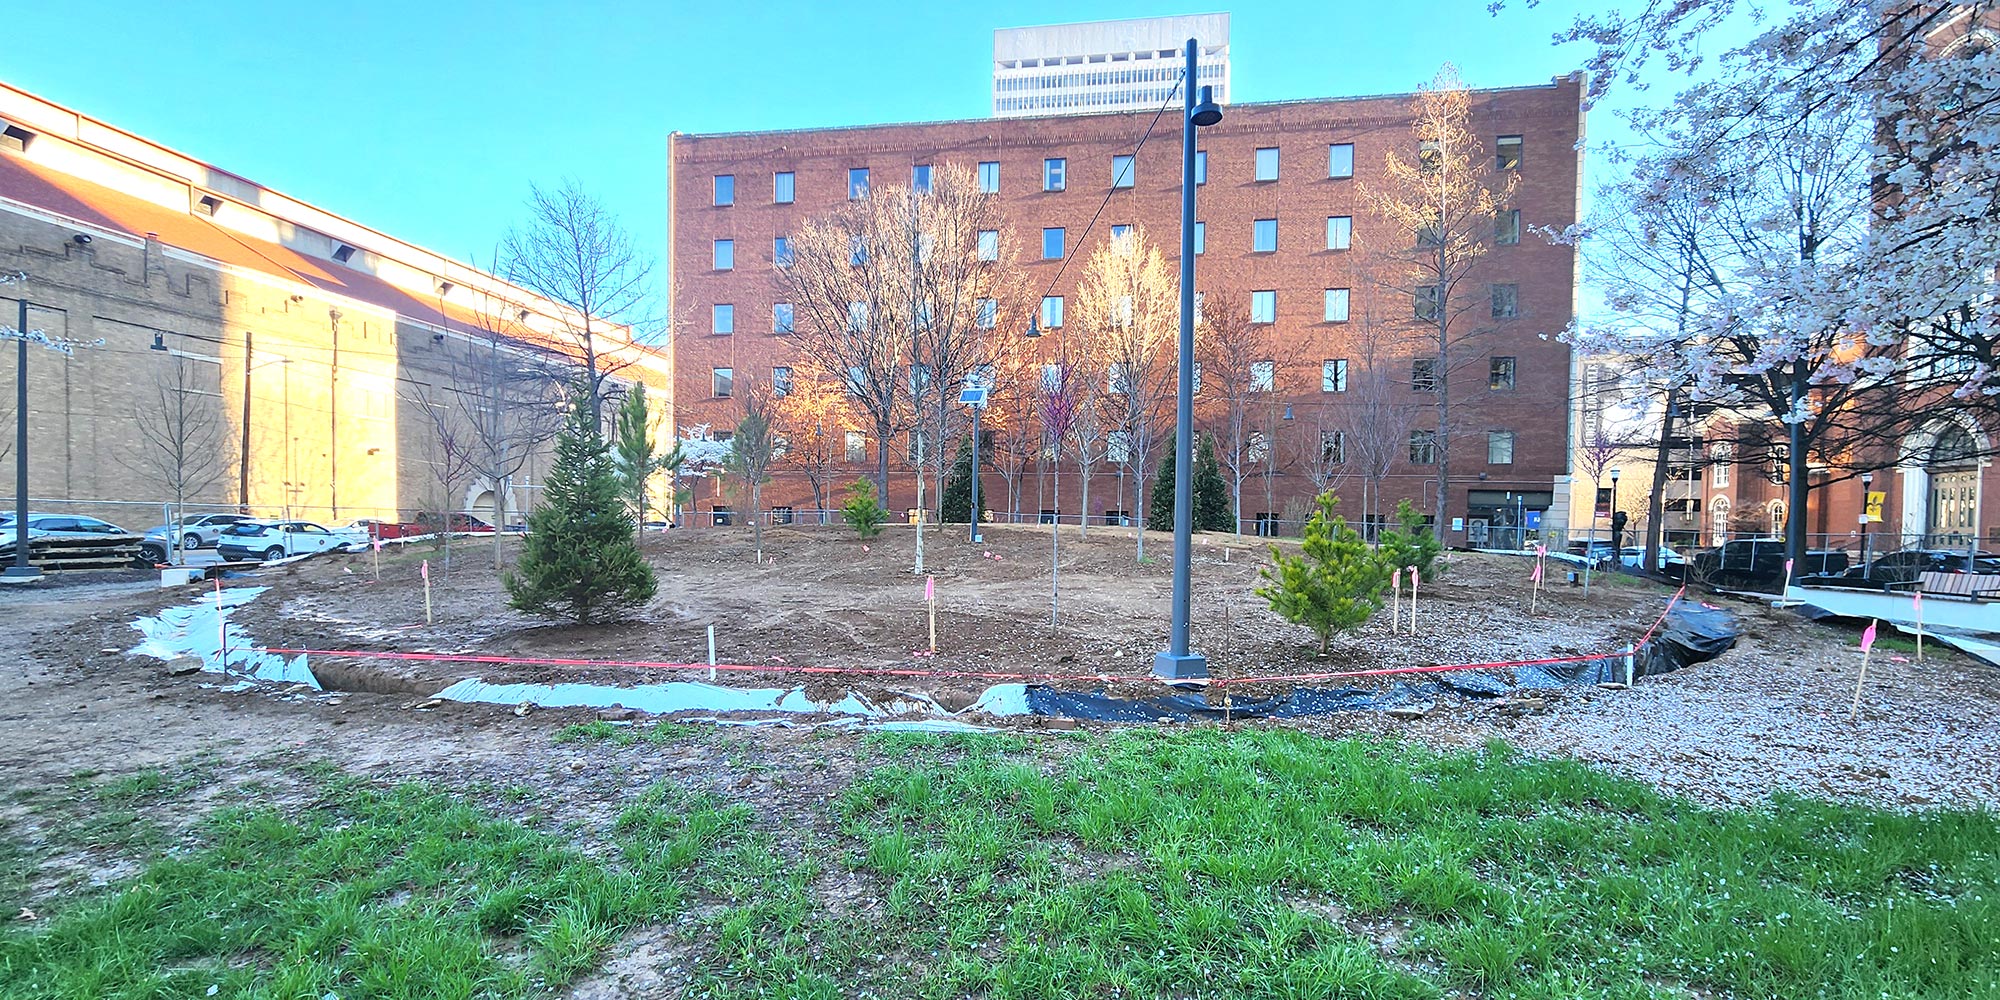
The mapping and ranking makes it clear what roadway corridors in Louisville are the grayest. Every single street downtown is surrounded by more than >50% gray surfaces. In some cases, they exceed 50% without even including the buildings. The top three are all some of the city’s most vital pedestrian and vehicle corridors: Main, Market, and Broadway. The land cover data utilized in the map is from before the East Market redesign, but that increase in canopy likely won’t be reflected much in the data for at least a couple years. Outside of downtown streets, roads in industrial areas also tend to have a significant amount of grayness.
The spatial distribution of the grayest corridors also present problems of equity. Practically all the greener corridors exist in richer, whiter parts of Louisville. The only green corridors in Western Louisville are dedicated parkways. This is not purely a difference of urban vs suburban urban form, as the eastern urban neighborhoods generally perform better in terms of canopy than their western counterparts.
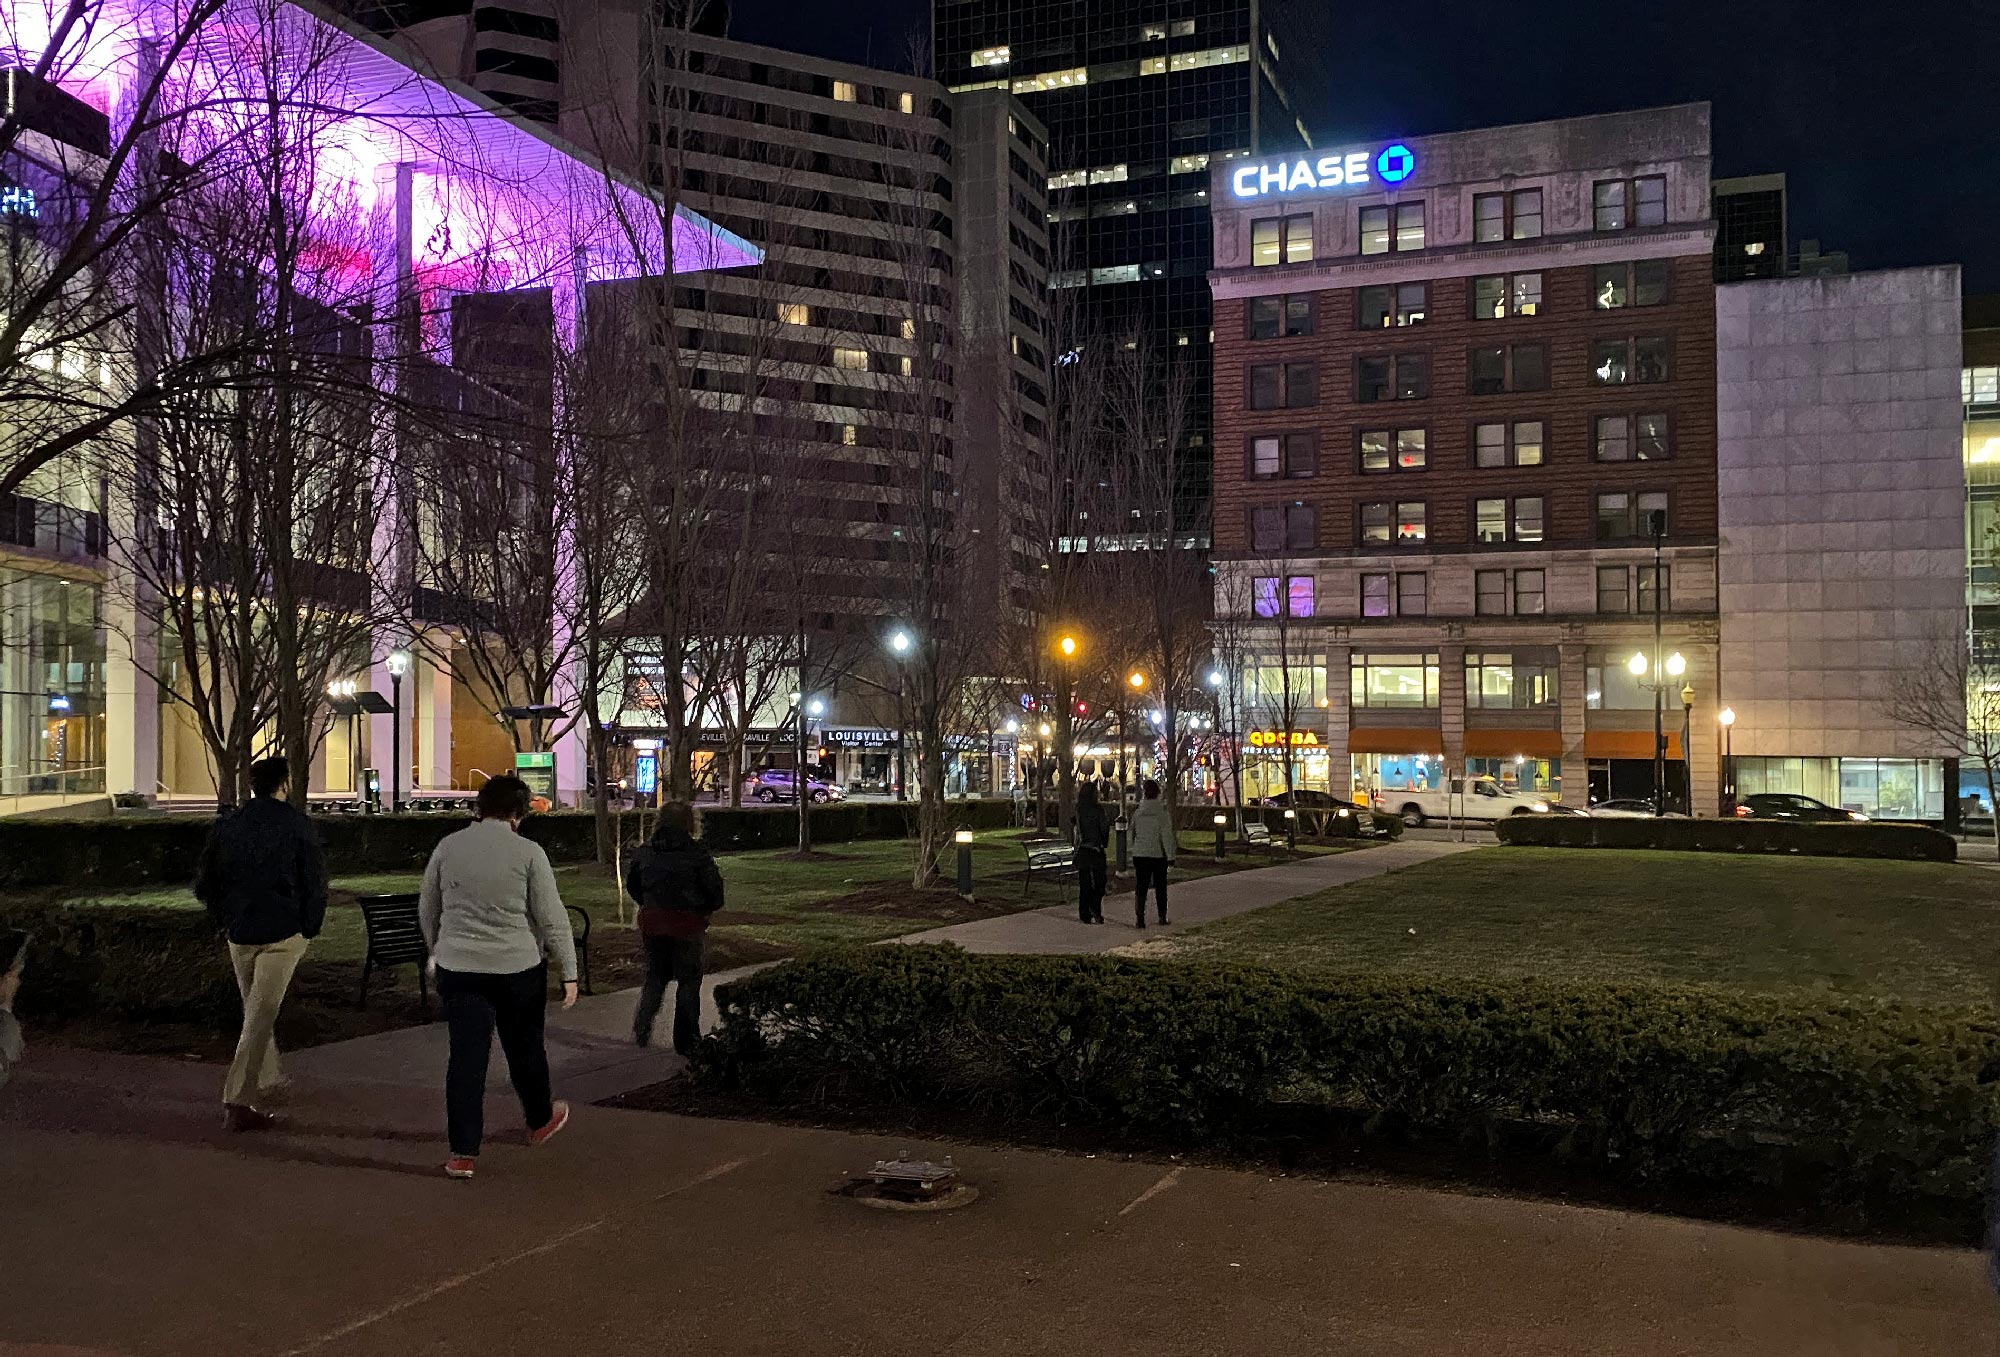
It is important to identify these impervious corridors, as they signal where street trees are likely needed the most. It can also let you know where certain problems are more likely to arise, such as bad air quality, urban heat, and lack of pedestrian activity.