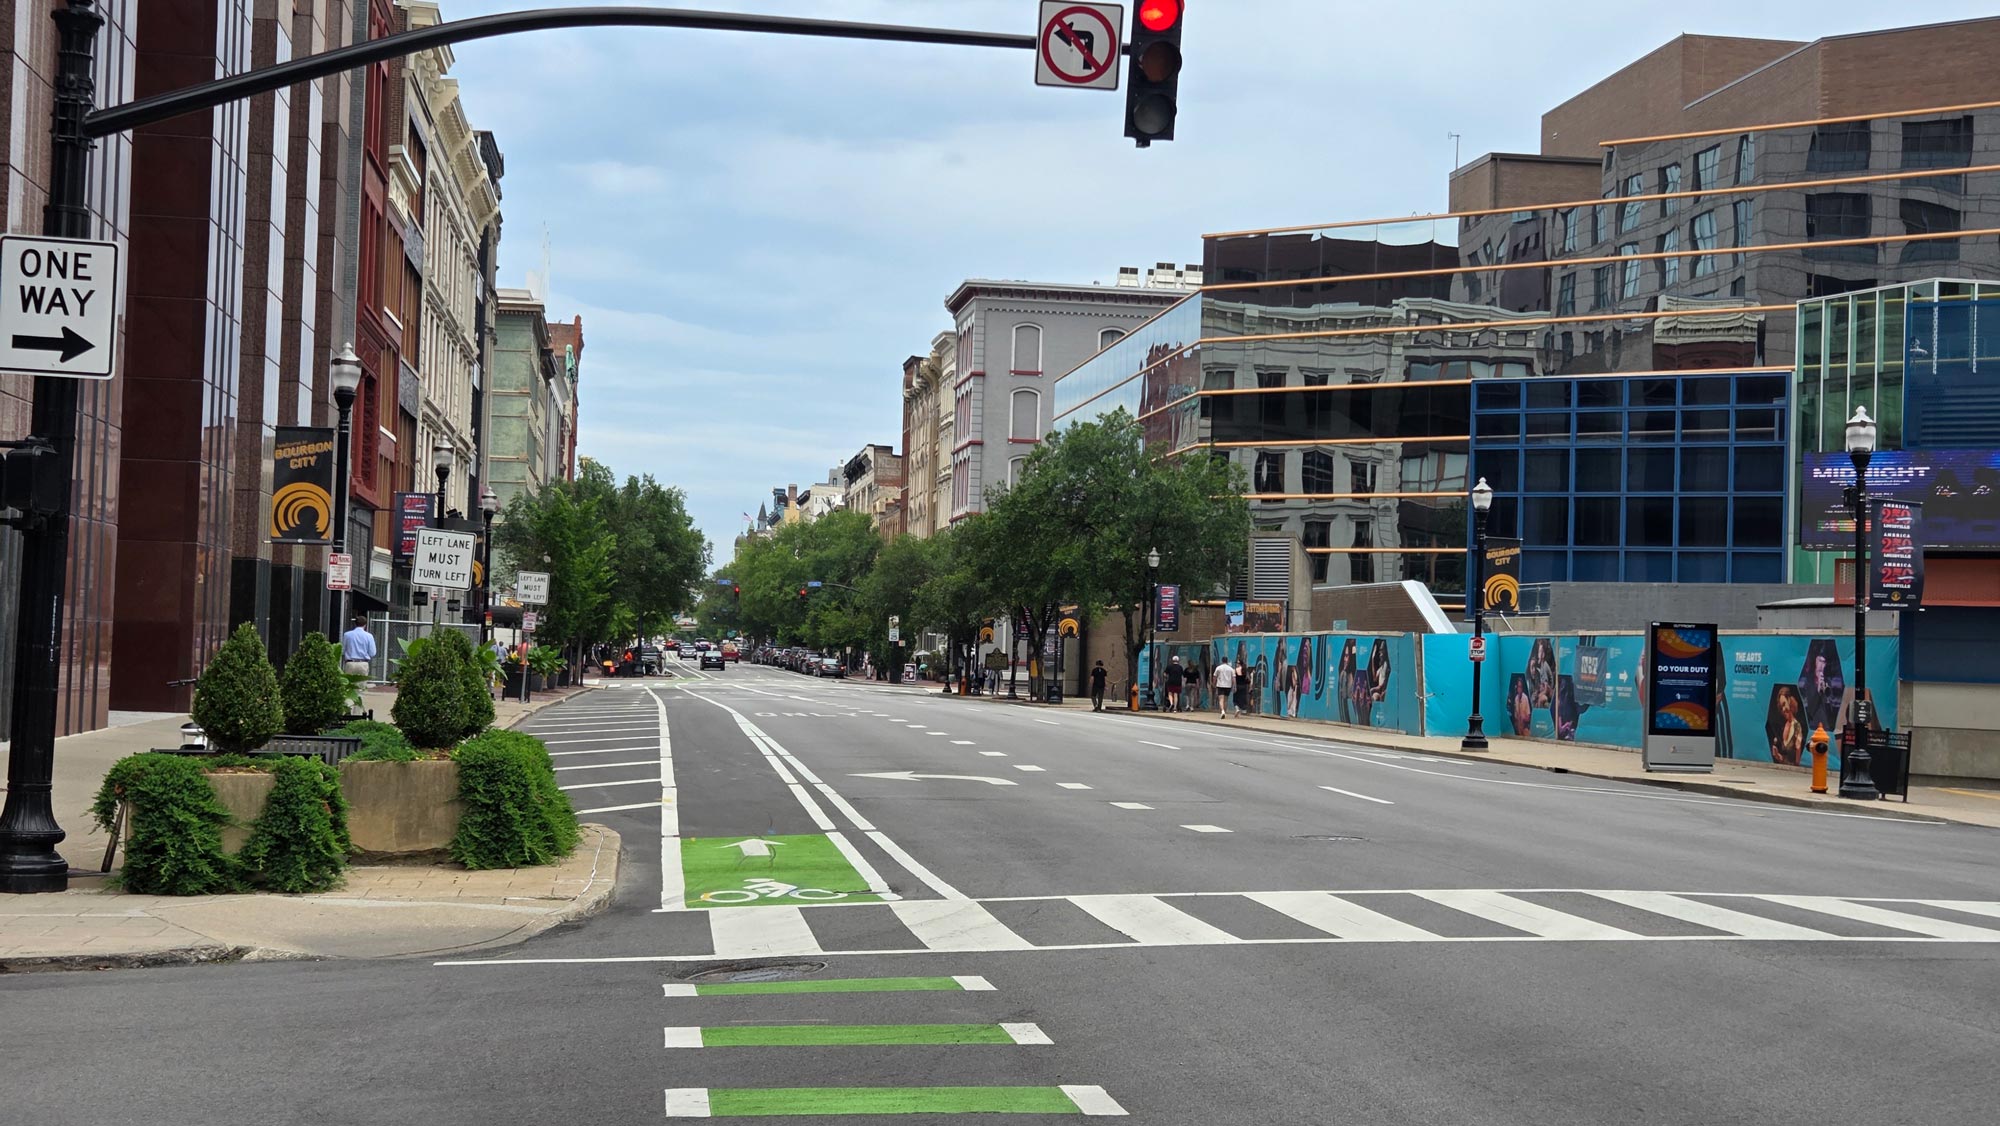
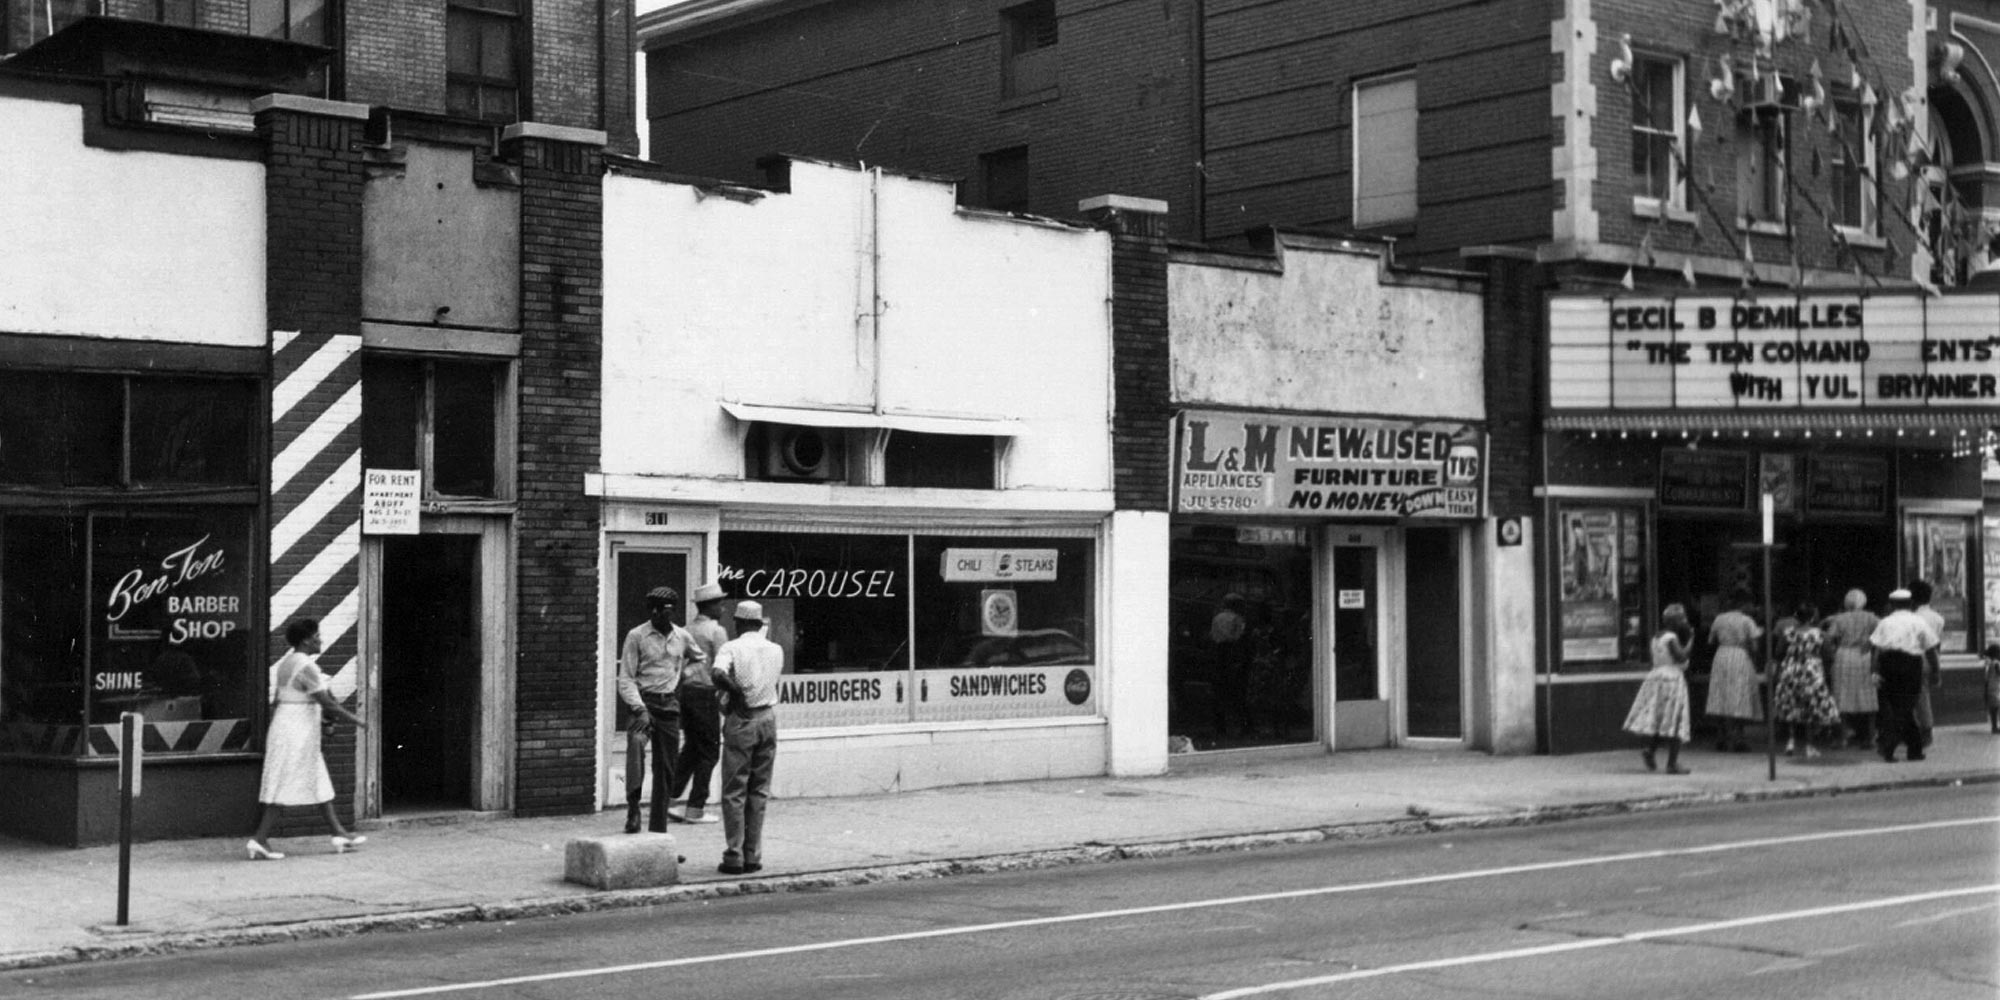
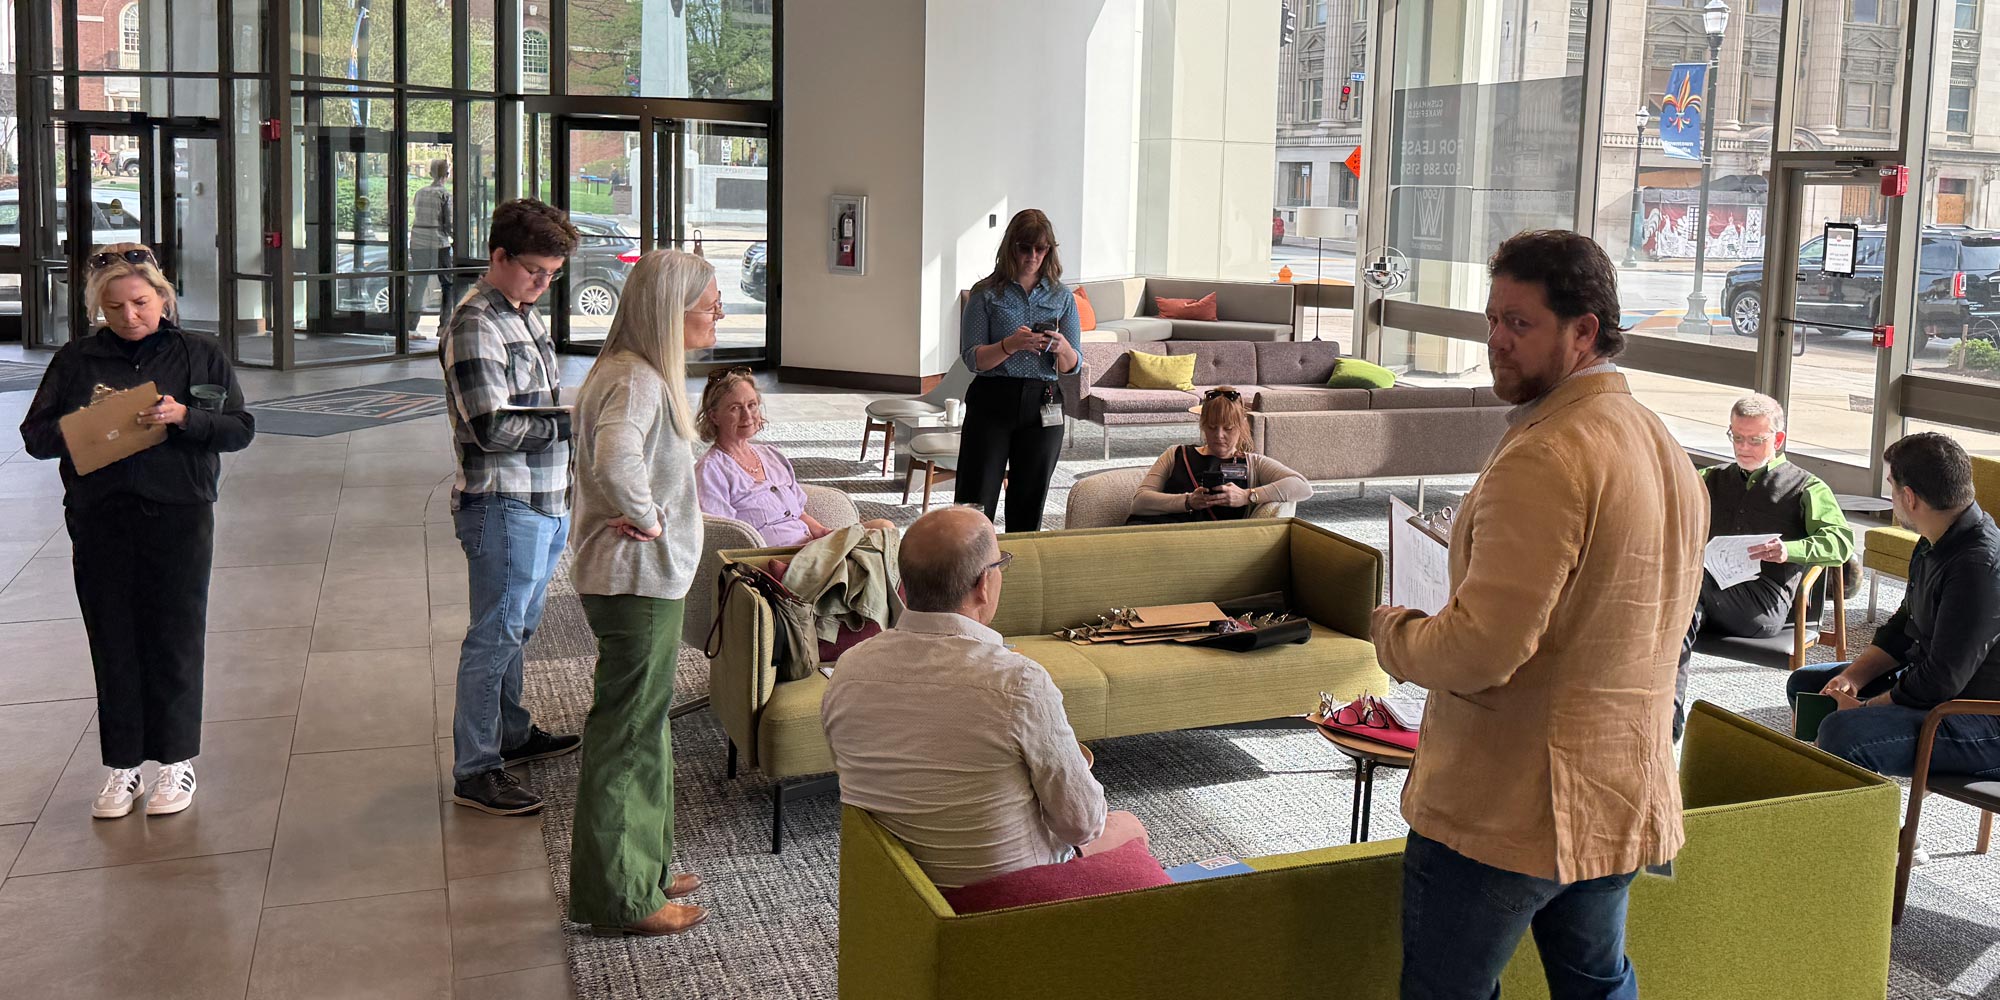
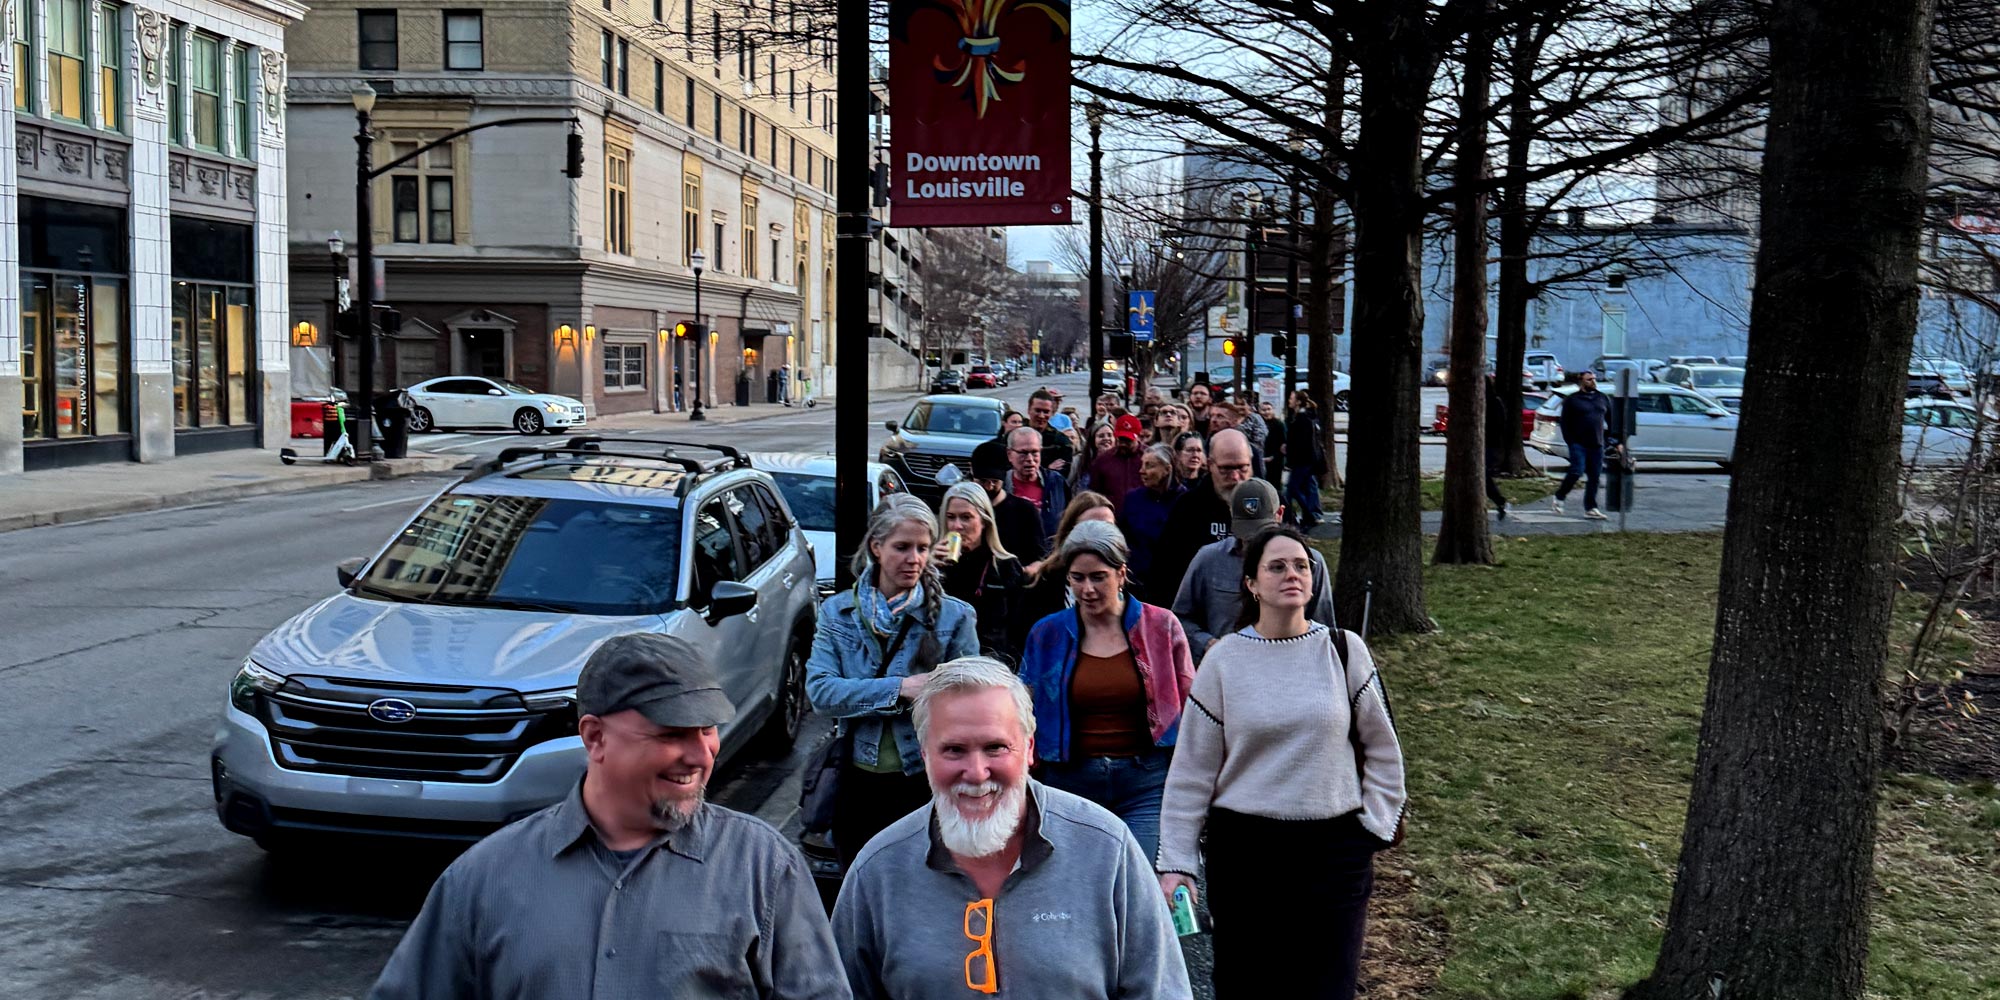
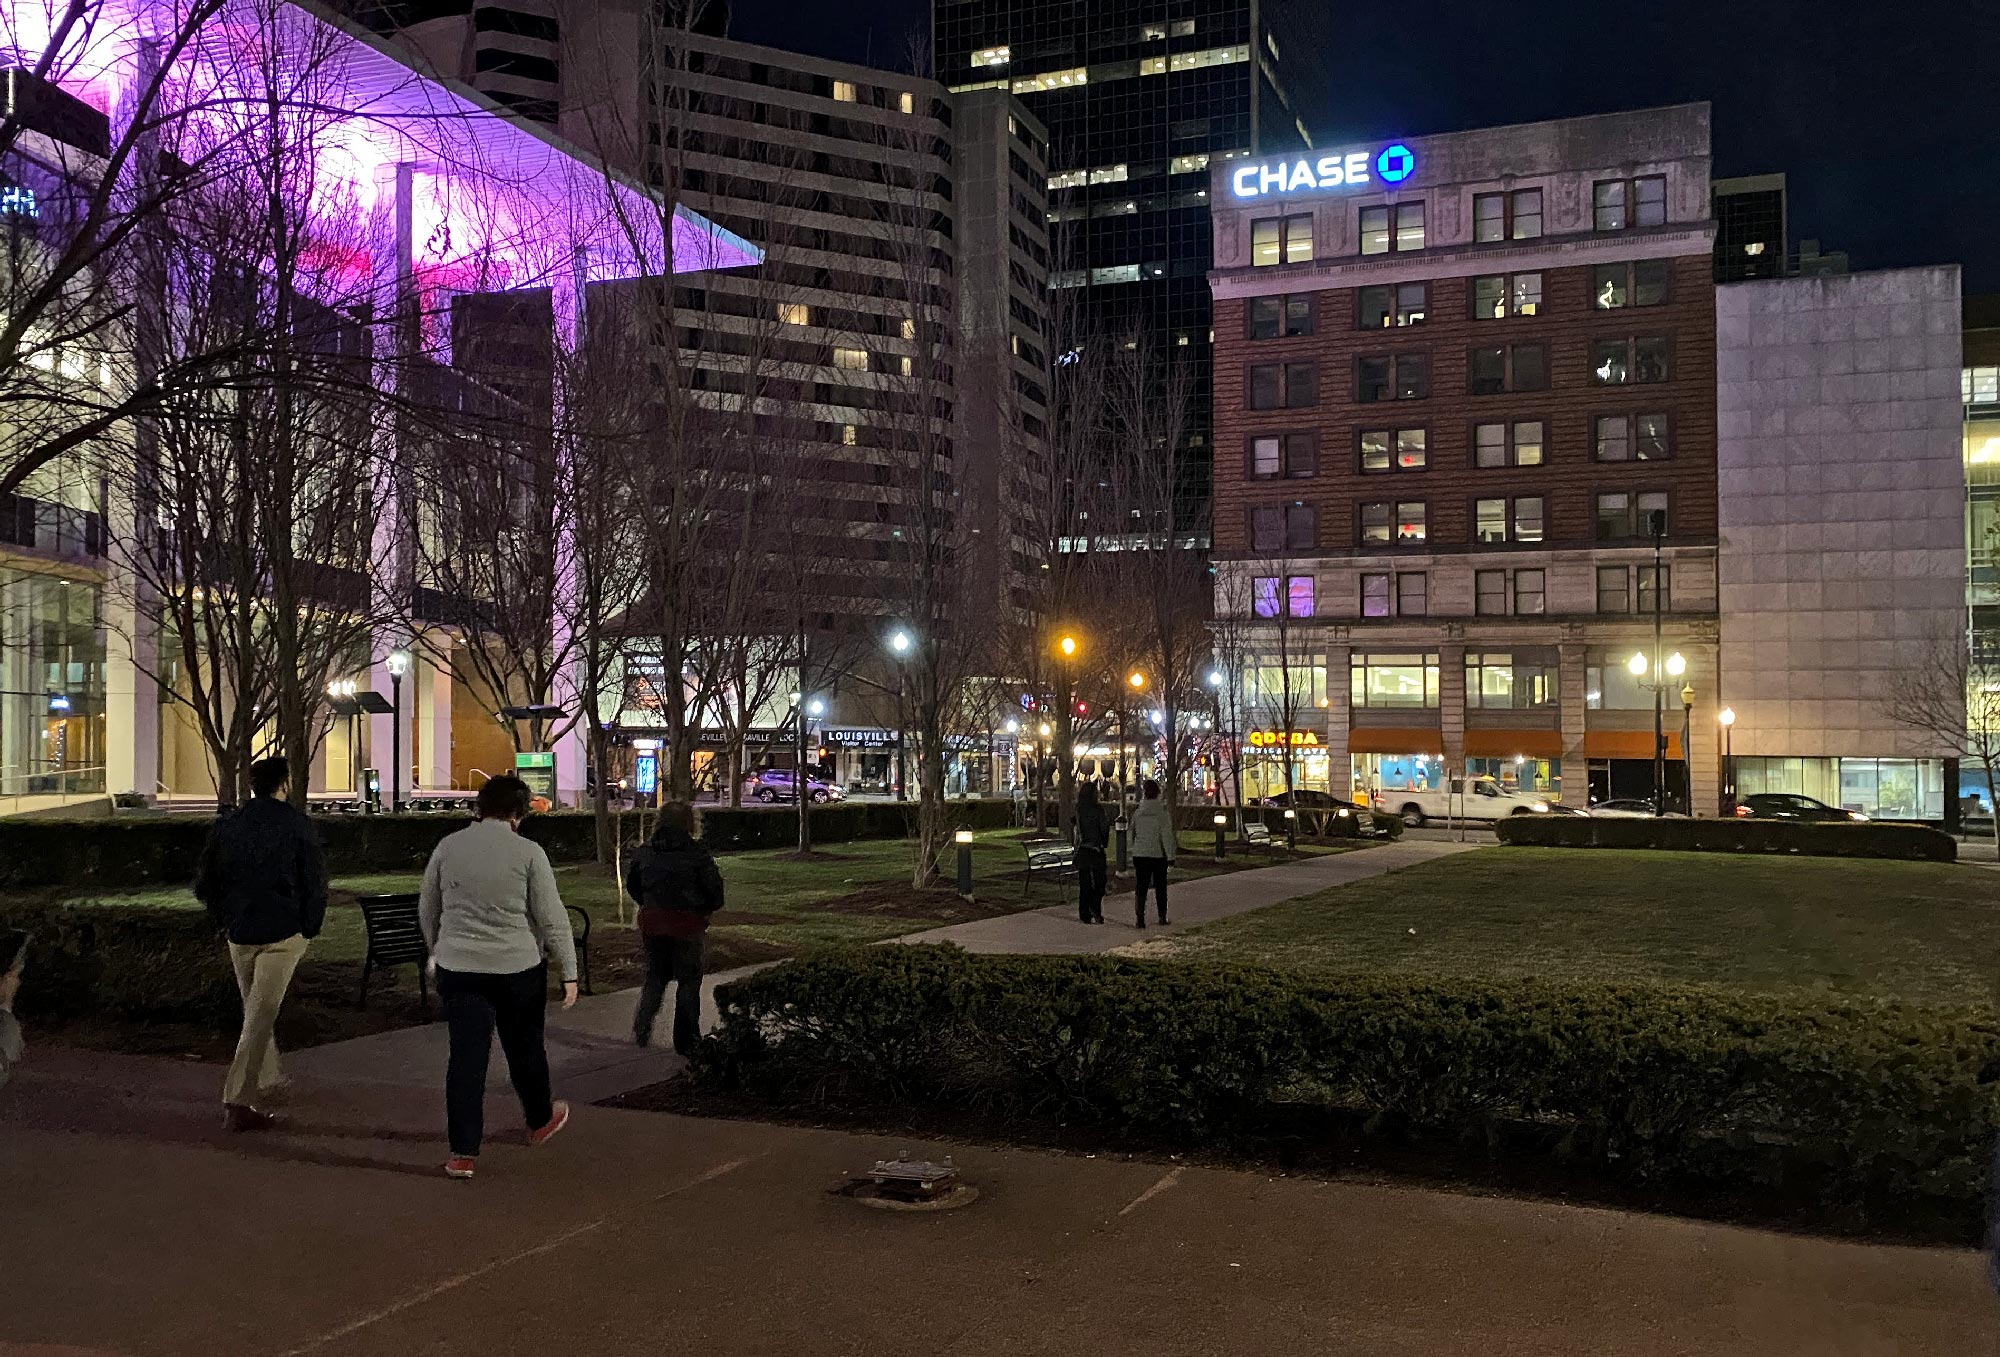
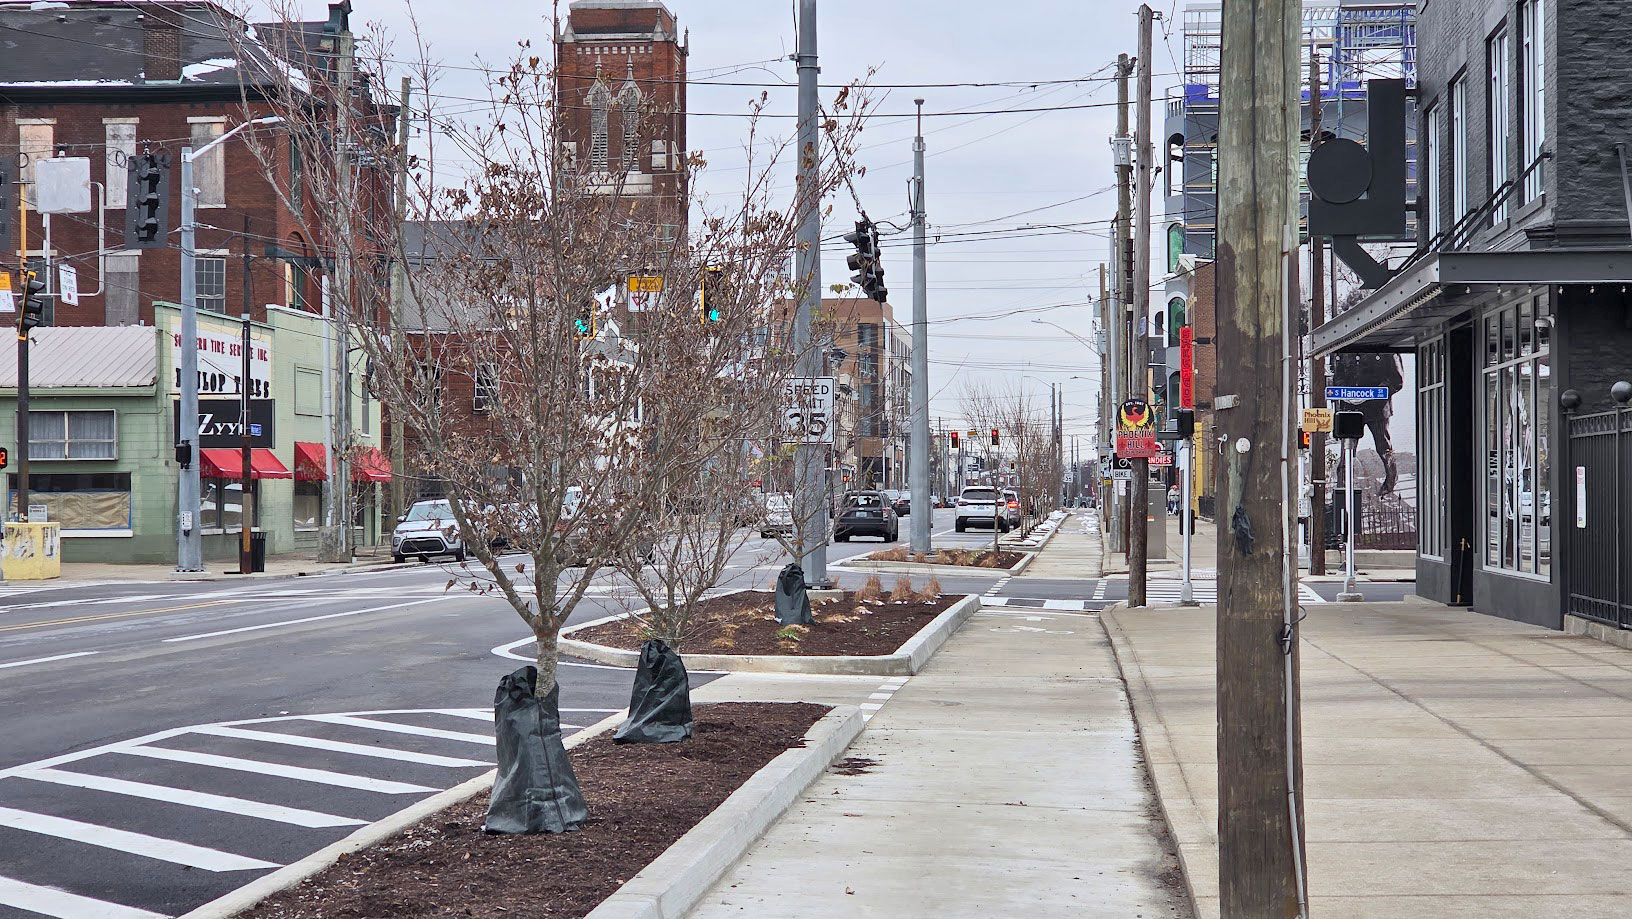
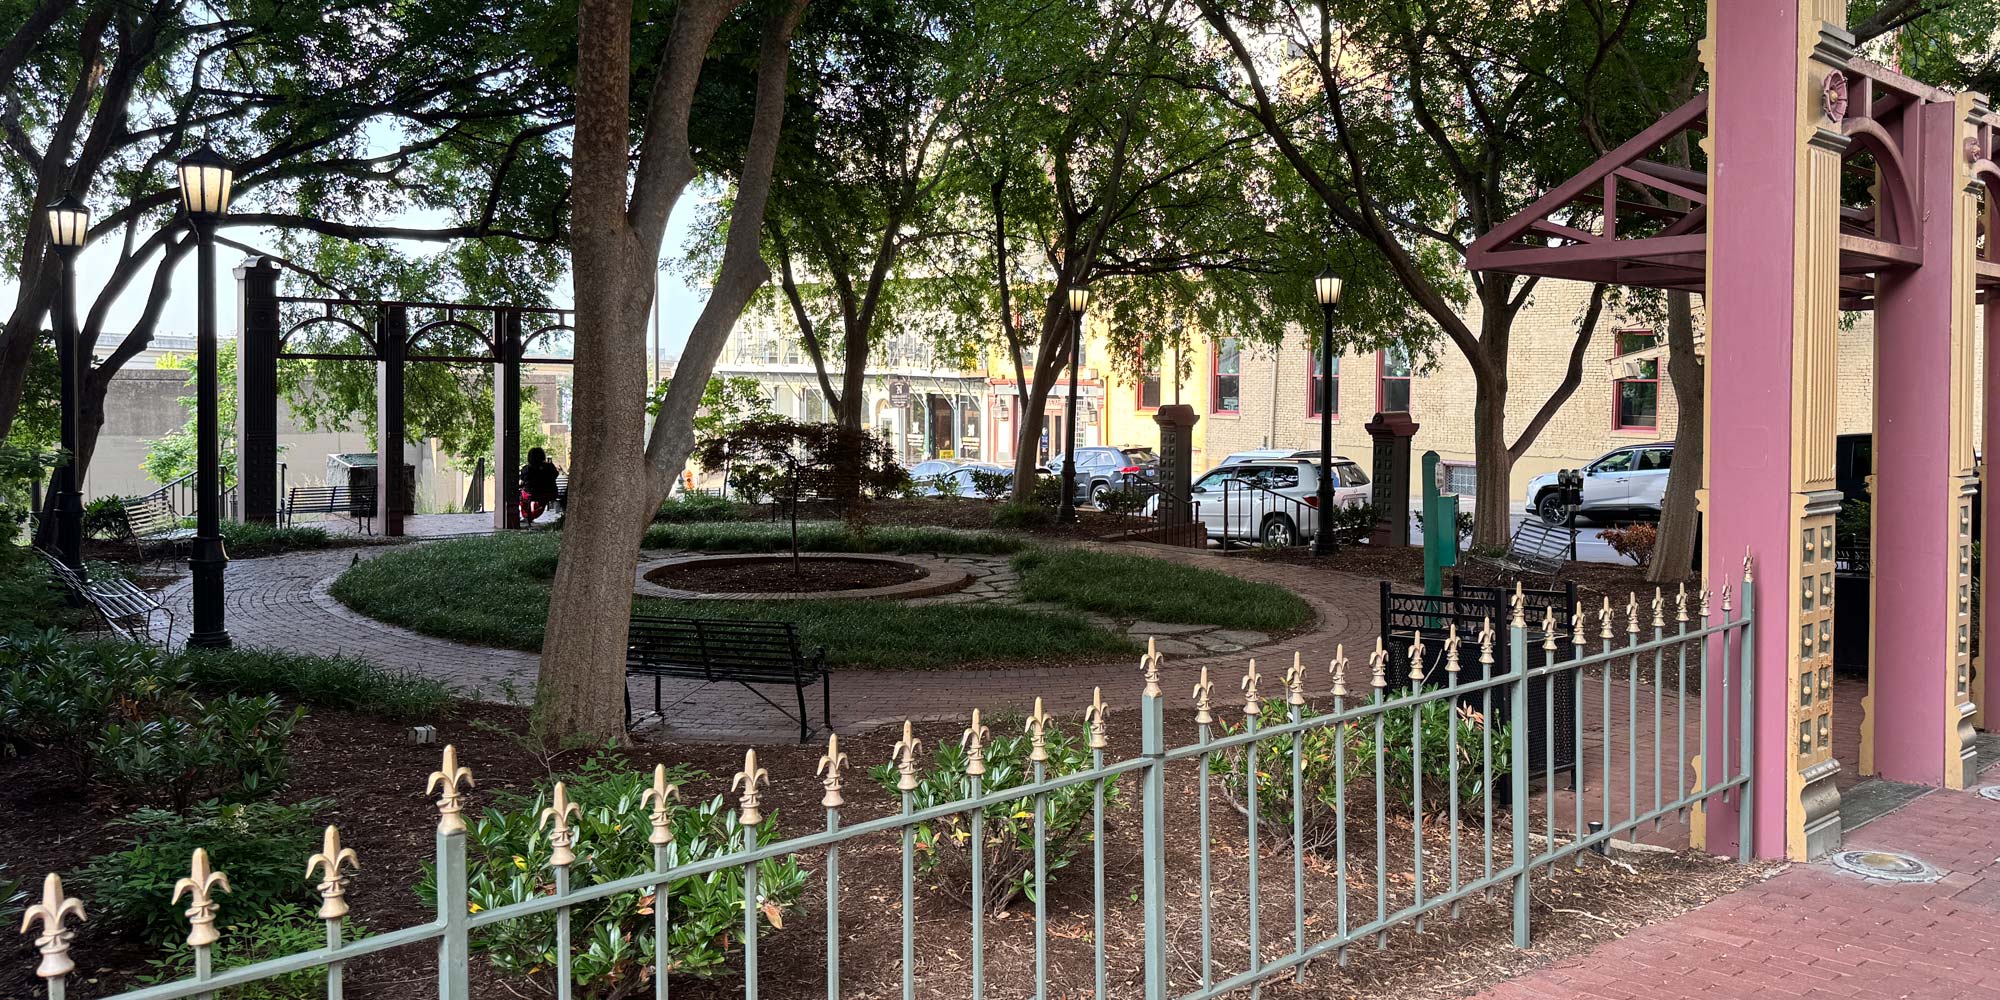
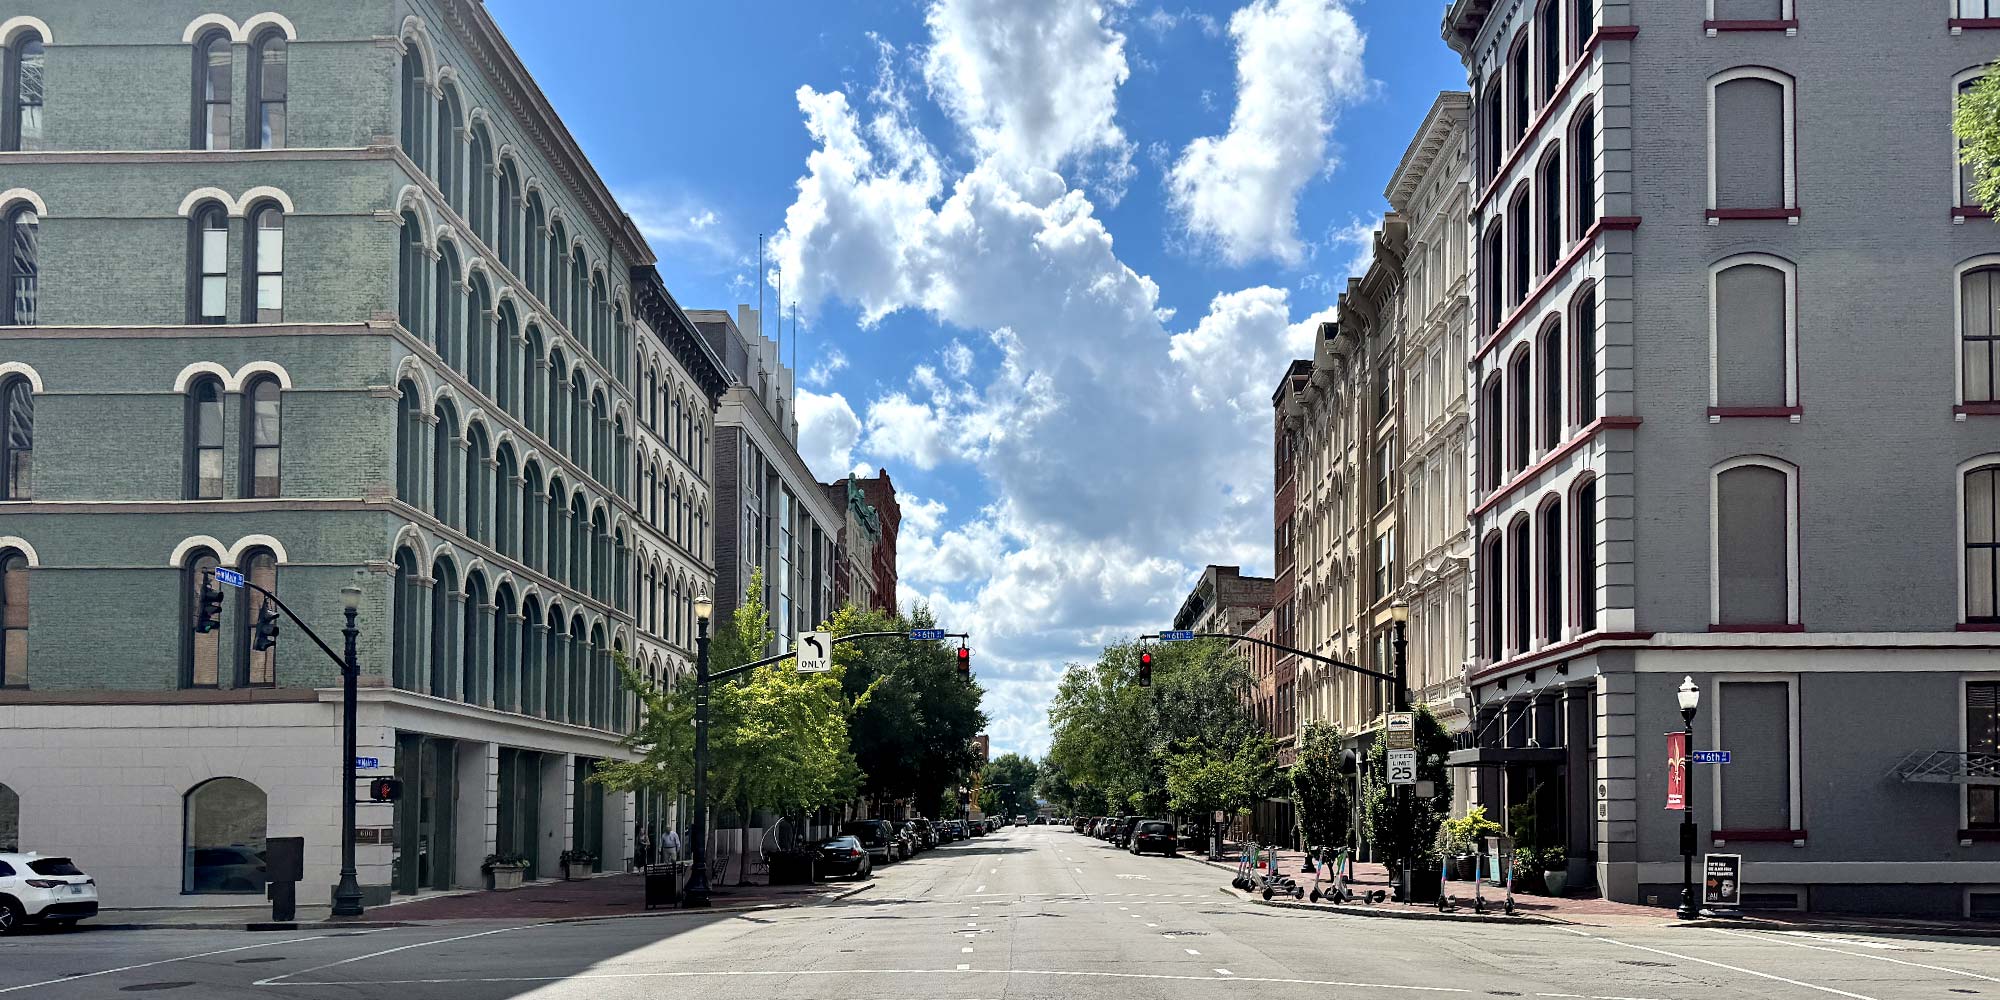
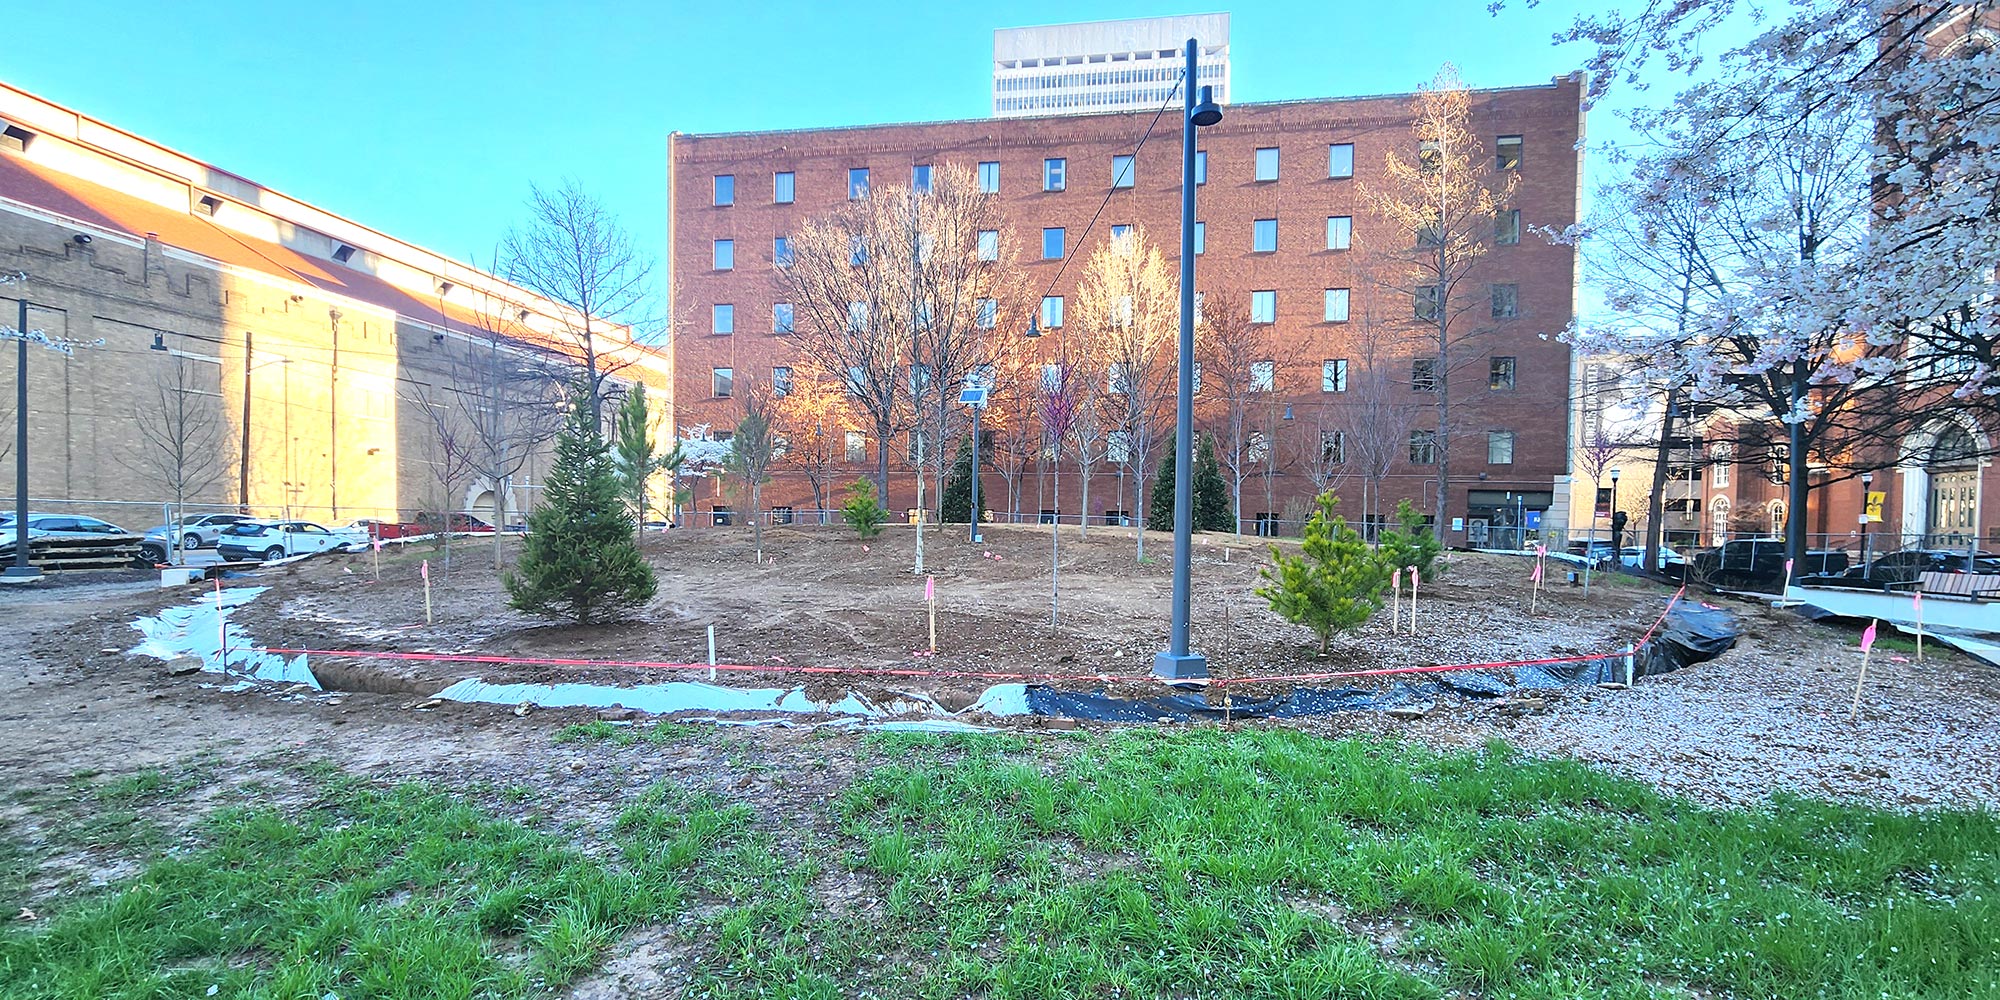
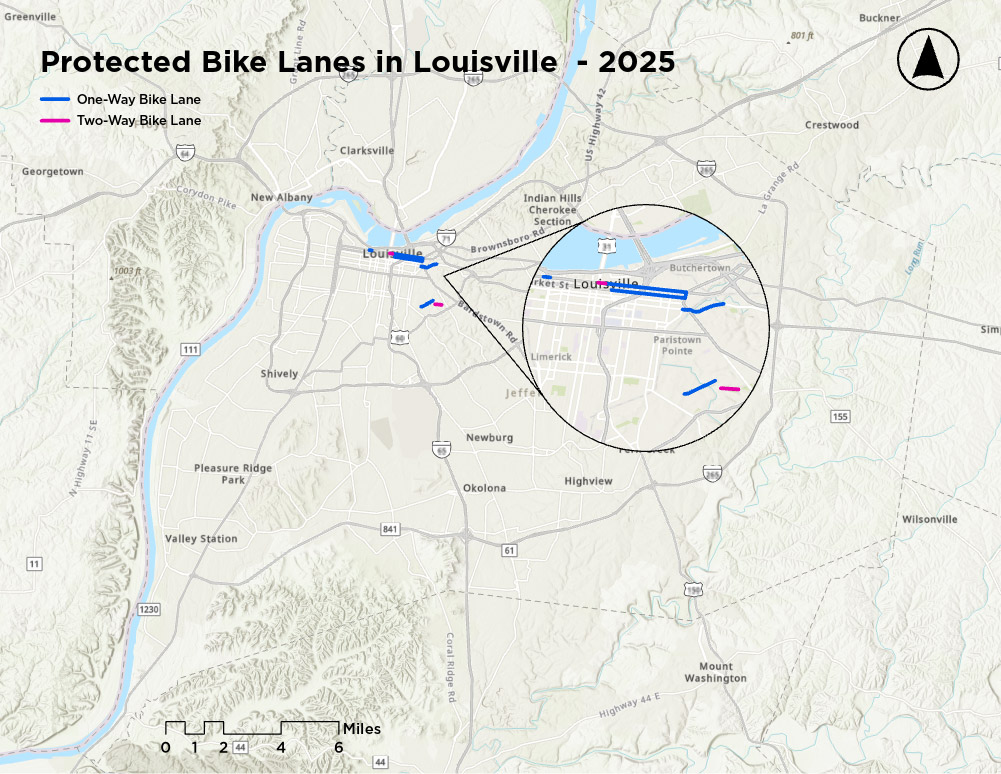
2025 saw another year of improvements for cyclists and bicycle infrastructure in Louisville. 2025 now holds the record for the biggest increase in separated bike infrastructure in city history (not counting Louisville Loop projects). East Market’s redesign was completed late last year, joined by a new bike lane on Baxter, connecting it to the new bike lanes on East Main Street. The bike lanes on East Main are not complete, but are generally usable. This adds a total 2.22 miles of protected bike lanes Louisville’s bikeway network, increasing the total extent by approximately 257%. This does not include some bike-lane adjacent multi-use paths, such as the new Seneca-Cherokee Connector and River Road Multi-Modal project which would bump the number up even more.
Separated bike infrastructure is the focus here, as it is generally accepted to be the best for cyclist safety and increasing ridership. Case studies in multiple cities such as New York City and Boston have shown several-fold jumps in bike-share ridership when protected bike lanes are constructed. A comprehensive 13-year study showed that cycling lanes benefit the safety of all road users. A 2025 study showed bicycle ridership nearly doubled with the construction of protected bike infrastructure. Much of the increase in ridership is connected to perception of safety, and this feeling of safety usually only comes when there is separated infrastructure. As Louisville builds more protected bike lanes, they will increase safety for riders while also increasing the total number of riders.
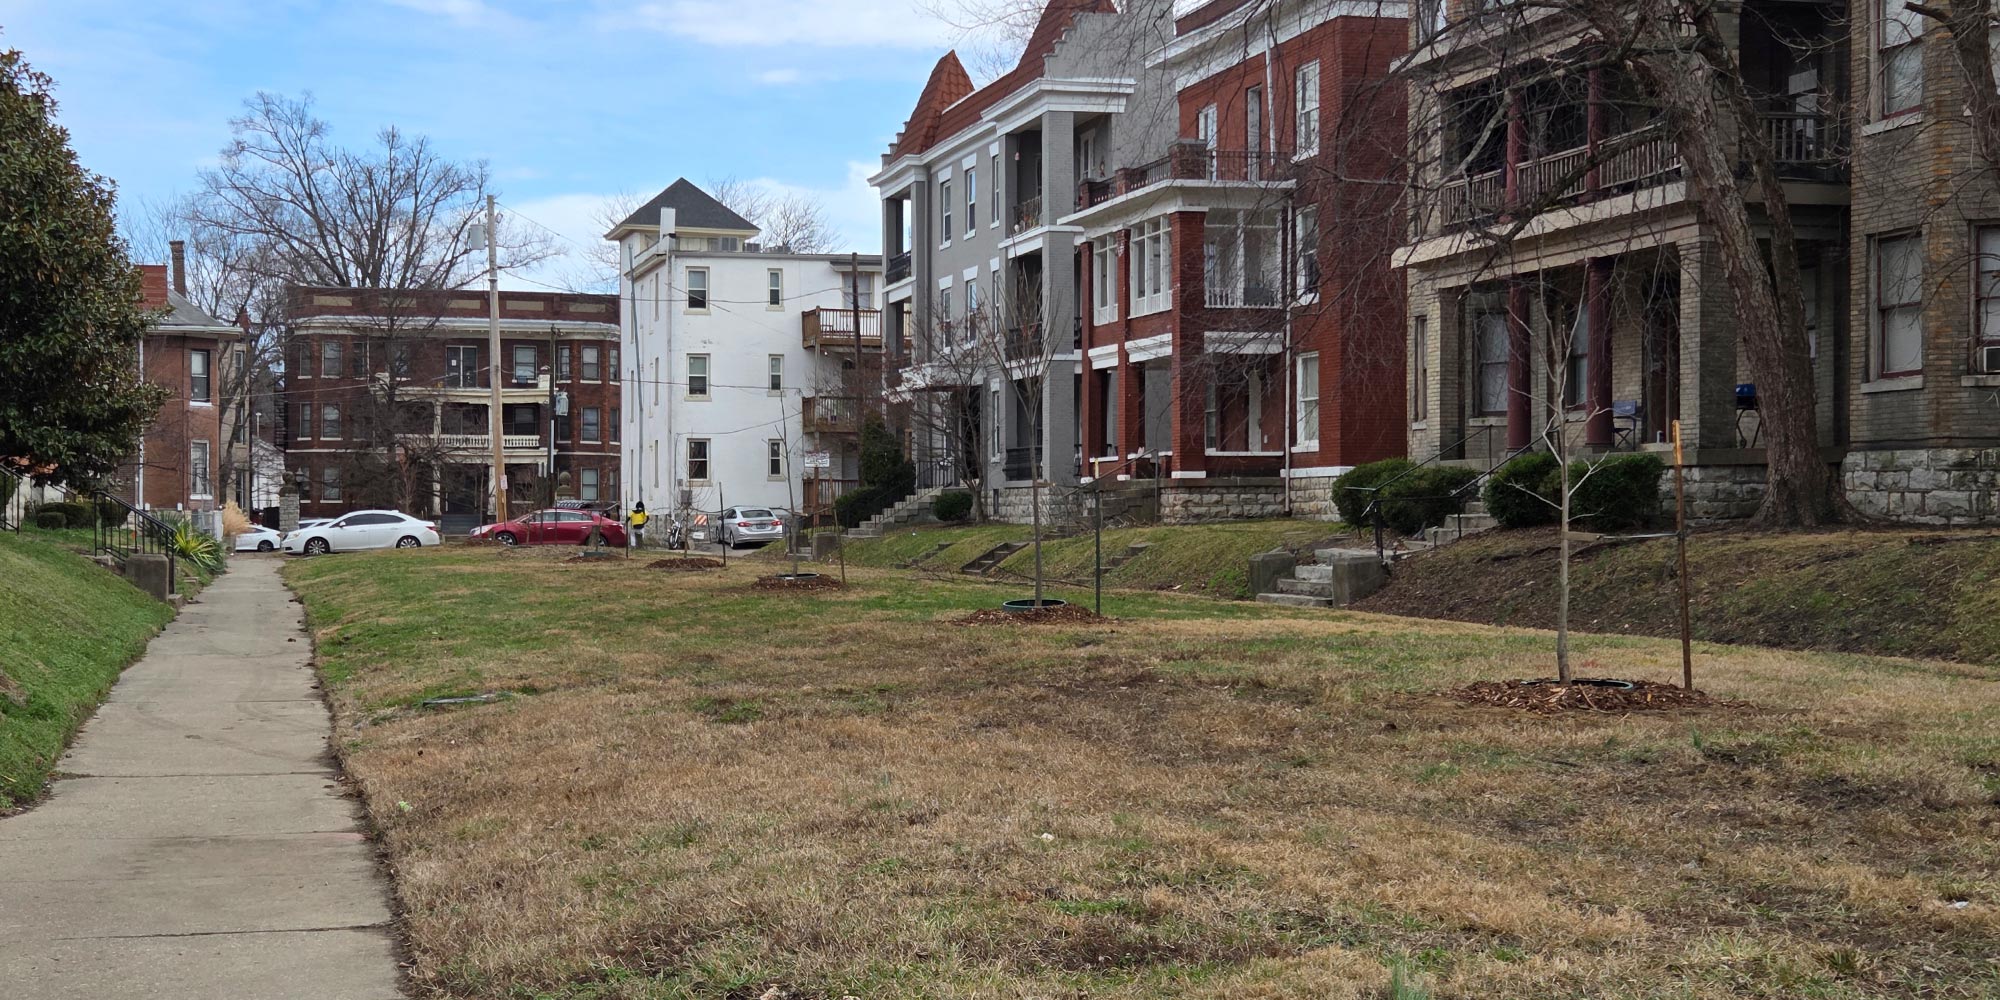
While 2025 was a great year for bicycle infrastructure, there is less down the pipeline for 2025. Work is expected to continue on design development for projects that will contain bike infrastructure such as Reimagine Ninth Street and Broadway all the Way, but actual construction is less than 2025. Much of the new infrastructure this year will likely come in the form of multi-use paths, such as the one that was recently built along River Road downtown. A good amount of unprotected lanes may also soon come from downtown’s planned two-way conversions.
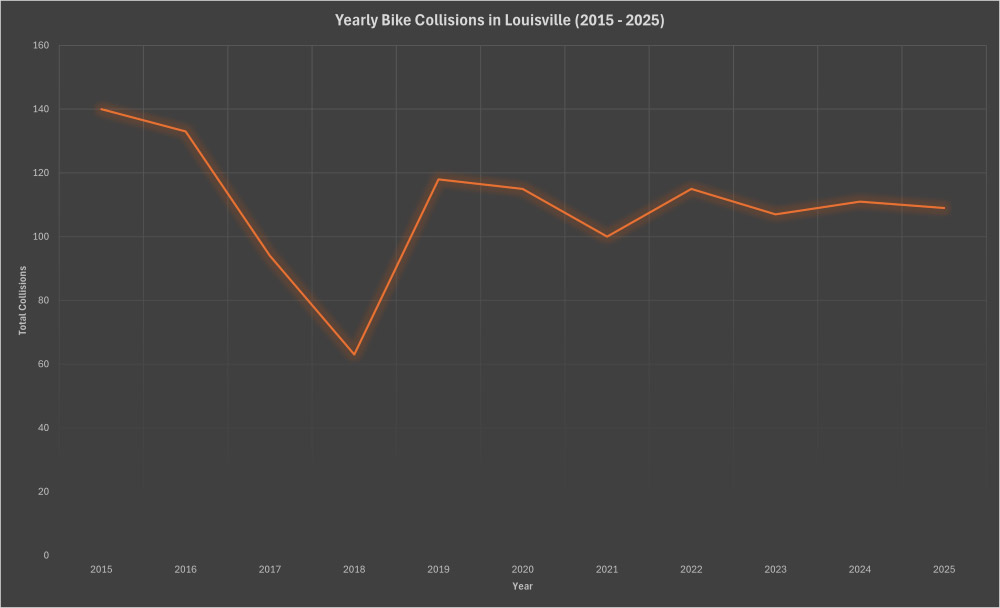
The Census Bureau was expected to release their 2024 American Community Survey (ACS) 5-year estimates last month that would give us the most up-to-date estimates of bicycle ridership in Louisville. Sadly, this was delayed until the end of this month, so our most up-to-date figures come from their 2024 1-year estimates. According to the 1-year estimates, bicycle remains the least common commuting method in Louisville; approximately 1577 commuters/0.5% of commuters travel to work by bike (note: the 1-year estimate has a margin of error of 0.3%). This would be nearly doubling the ridership of 2023, but the number is likely overblown by the high margin of error.
If we assume the yet-to-be released 2024 5-year estimate is similar to previous years, then collisions have remained stable relative to the number of riders. If the 1-year is accurate (which generally has not been in the past), then collisions have gone down substantially in relation to the total number of riders. It is likely safe to assume ridership has not changed much, given the new infrastructure that could increase ridership was only completed towards the end of the year.
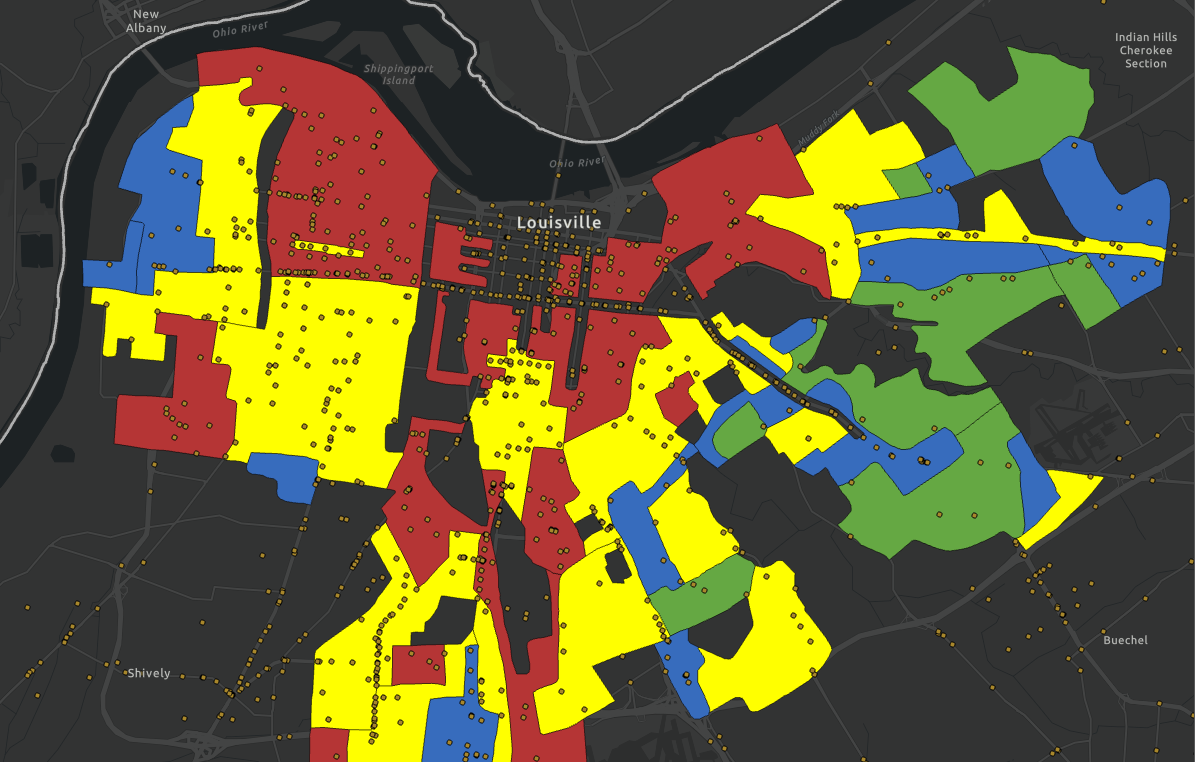
Traditionally, the spatial trends of the collisions are mapped out with a heat map. In the case of Louisville, we have low enough ridership to where collision hotspots would simply indicate where people bike rather than what places are actually dangerous. For example, Old Louisville has a lot of bike ridership and Okolona has practically none, but a heat map would make it seem like Okolona is safe while Old Louisville is not since no collisions have occurred in Okolona. This is why the collision dashboard below shows the collisions individually.
Click here to view the map in a separate window.
This is the third year in a row we have taken a look at the spatial trends of bicycle safety in Louisville, and for the third year in a row many of the most dangerous roadways from the past remain at the top of the list. To some extent, this reflects the length of the roadways. Dixie Highway and Broadway are in the top 5 again, and are some of the longest urban roadways in the city. At the same time, many of these roadways have the design features that are proven to make cycling more dangerous: wide roads, high speeds, high vehicle traffic, and lack of protection.
In 2025, there were four cyclists killed in collisions with vehicles. Three occurred in the more suburban parts of Jefferson County (outside 264). Two of these occurred on major arterials (Dixie Highway and Hurstbourne Parkway), while the other occurred on a neighborhood road. None of these roadways had any kind of bicycle infrastructure. The one death that occurred in the urban core was located at Floyd and Market. This is, for whatever reason, the only death that does not have any kind of documentation in local news sources so the timing is unknown beyond it occurring in 2025. This may have been before or after the construction of the bike lane on market, although there was a pre-existing lane on the south side of Floyd in that intersection.
Louisville has seen substantial improvements in bike infrastructure over the past couple years, but cycling safety outcomes have remained relatively stagnant. The infrastructure improvements have largely been concentrated in Louisville’s eastern urban neighborhoods, while roadways that have seen many collisions every year (Dixie Highway, Broadway, Preston) have not seen any improvements or creation of adjacent bicycle routes. There are long term changes down the pipeline that will improve things, such as the previously mentioned Broadway all the Way, but smaller scale projects that would have smaller timeframes seem to have fizzled out for 2026. Despite that, there are a litany of cheap solutions available for Louisville to utilize that would make cycling safer, such as parking-protected bike lanes, bike boxes, and two-way conversions.