One of the signature markers of urban vitality in modern times is population density. Population density is now often characterized by access to public transportation, walkability, density of amenities, and higher income. These characteristics are generally positive for health outcomes (2) (3), which is the exact opposite of what planners would have expected a few decades ago.
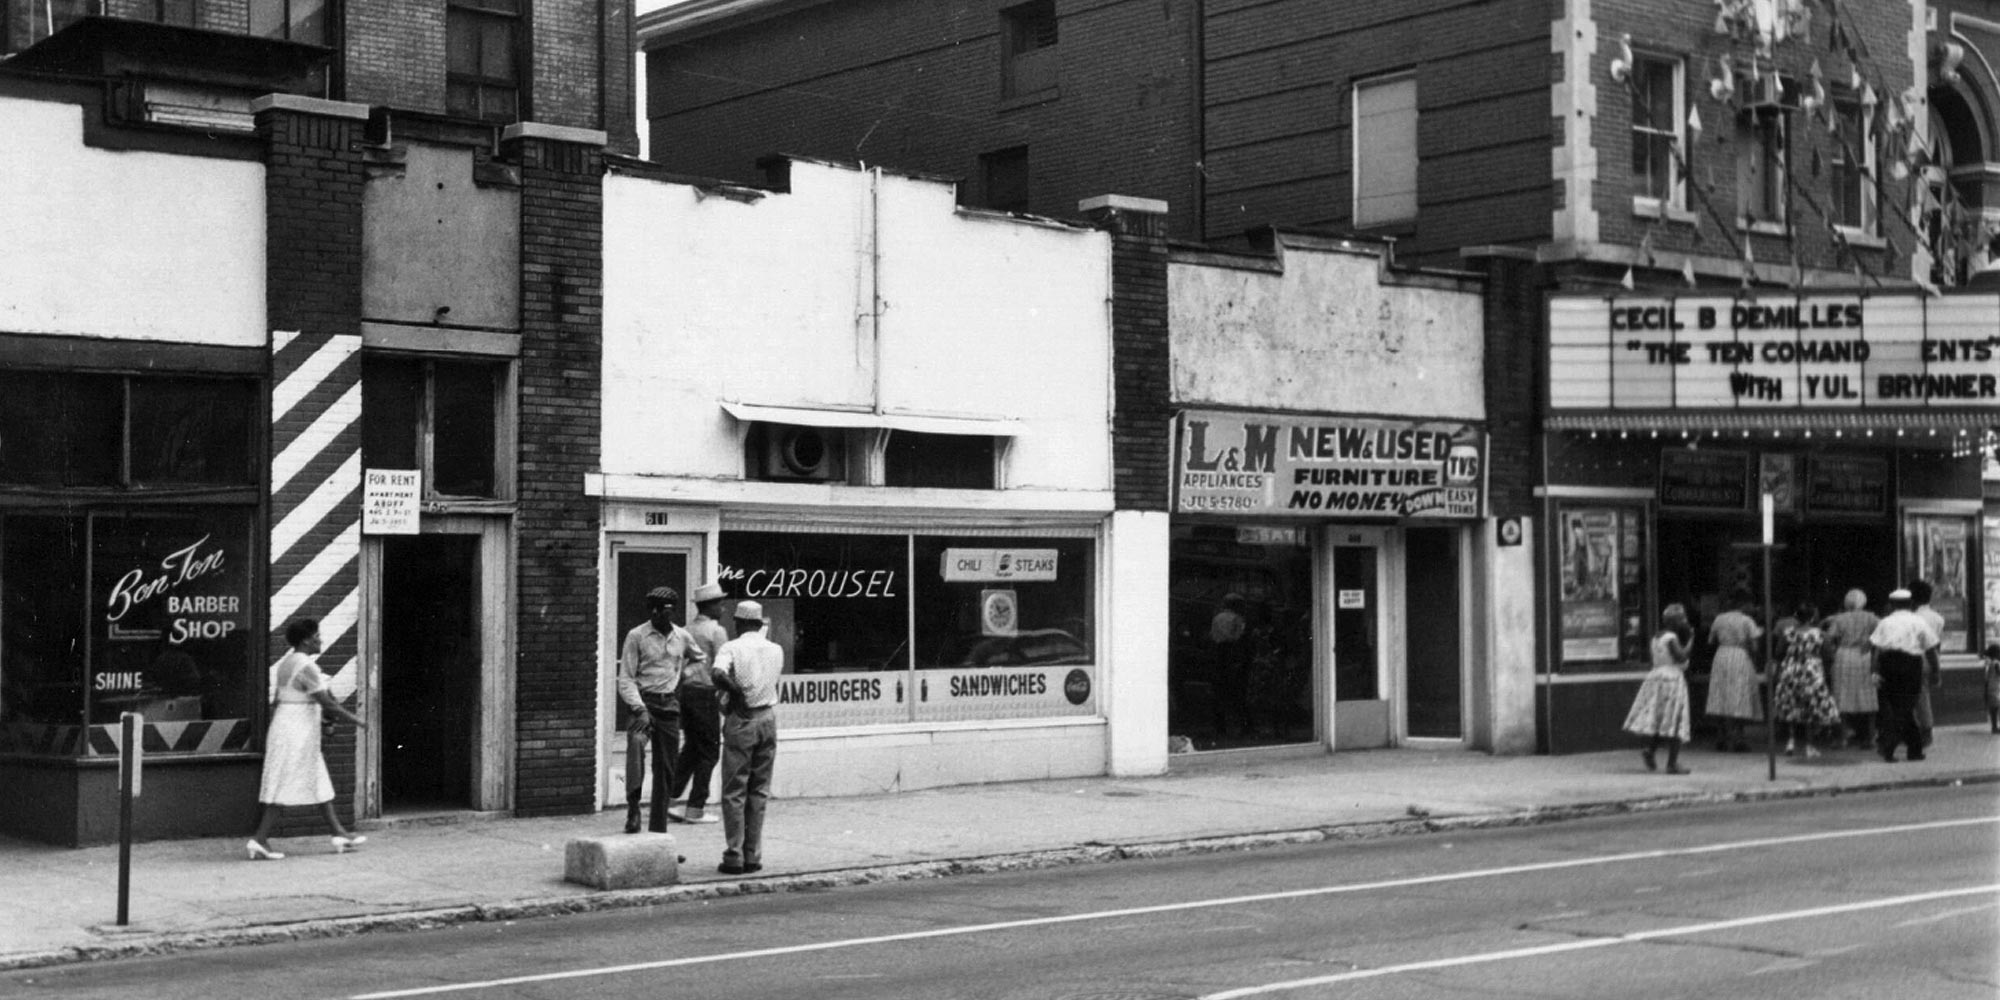
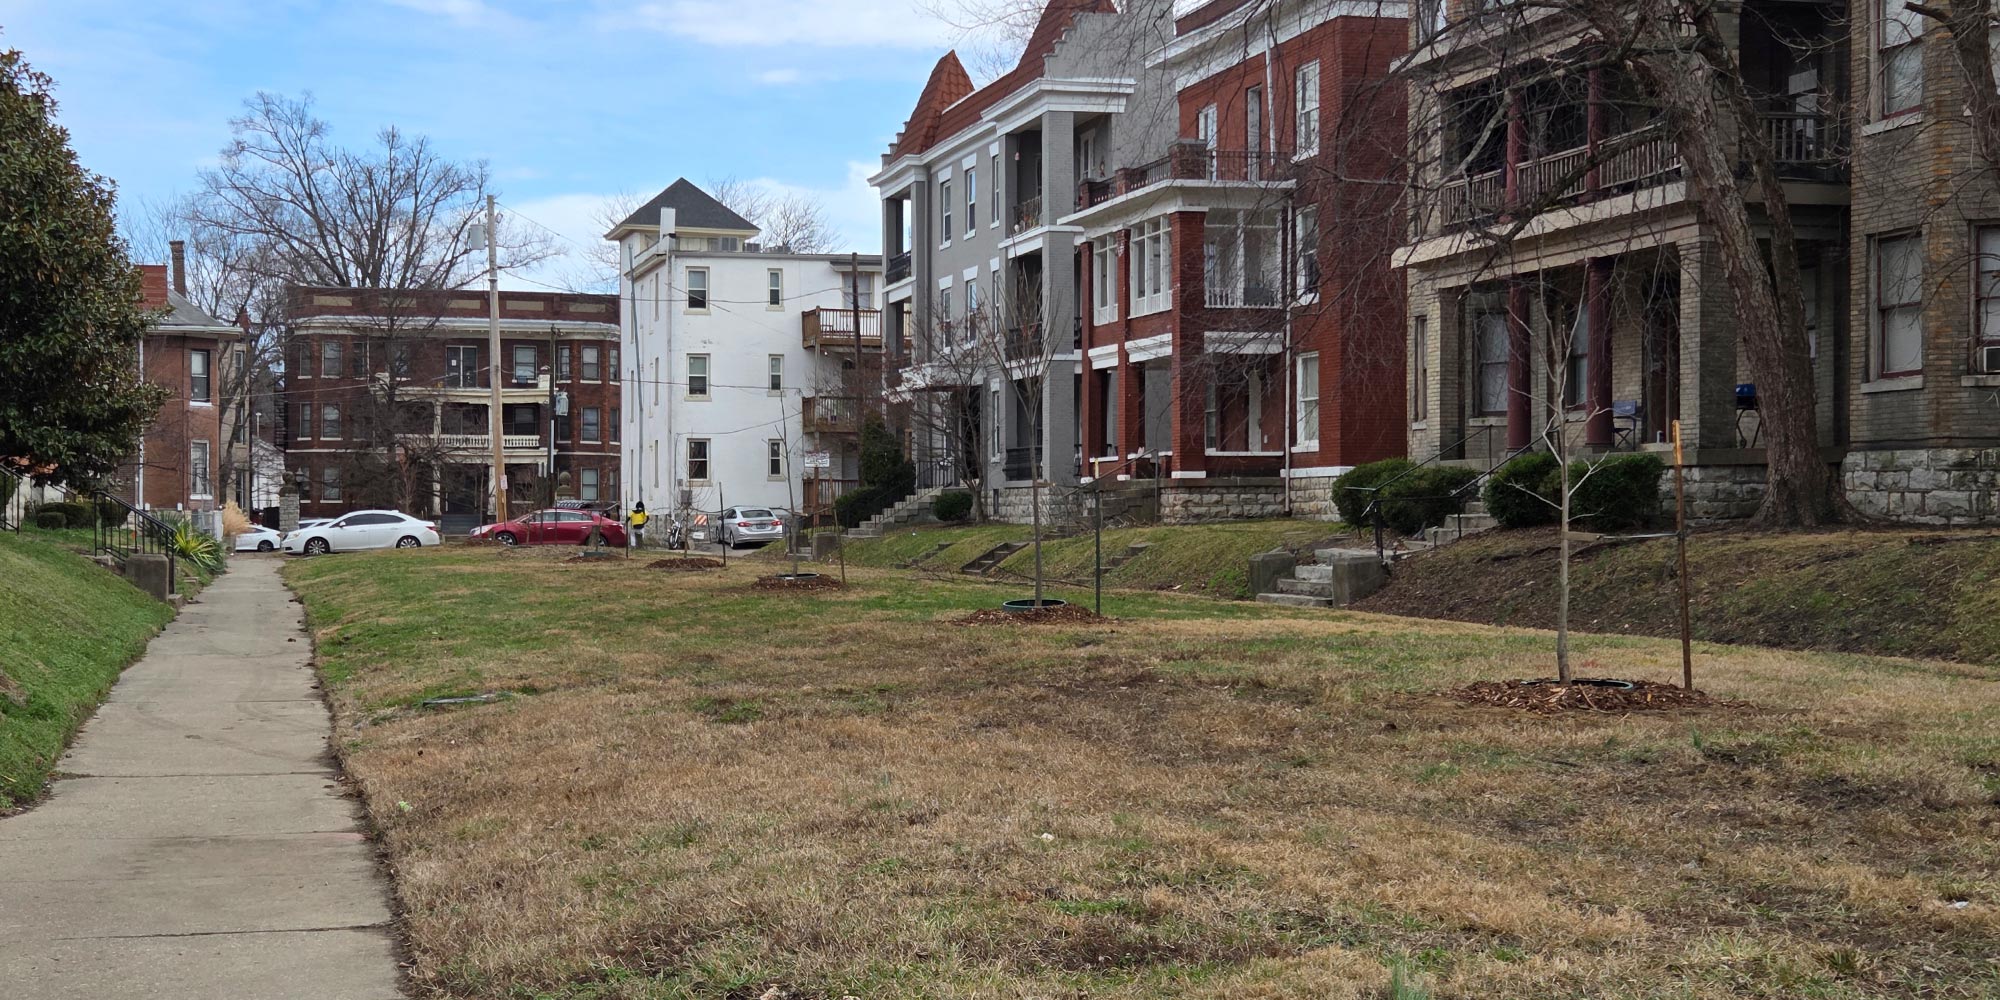
In North America’s past, population dense areas in cities were often characterized by unhealthy conditions. Proximity to industry, overcrowding, and lack of sanitation could make city life difficult for residents; throw in a lack of transportation and walkability, and you get very tightly-packed urban areas with disastrous implications for human health. This was, at face value, the reason for programs like urban renewal. Large swathes of our cities were demolished and the population dispersed across the city. This “renewal” and other slum clearance programs were usually racially motivated, and occurred as car dependence became widespread across the United States. This creates the perfect conditions to depopulate urban neighborhoods and create a low-density, suburbanized urban form.
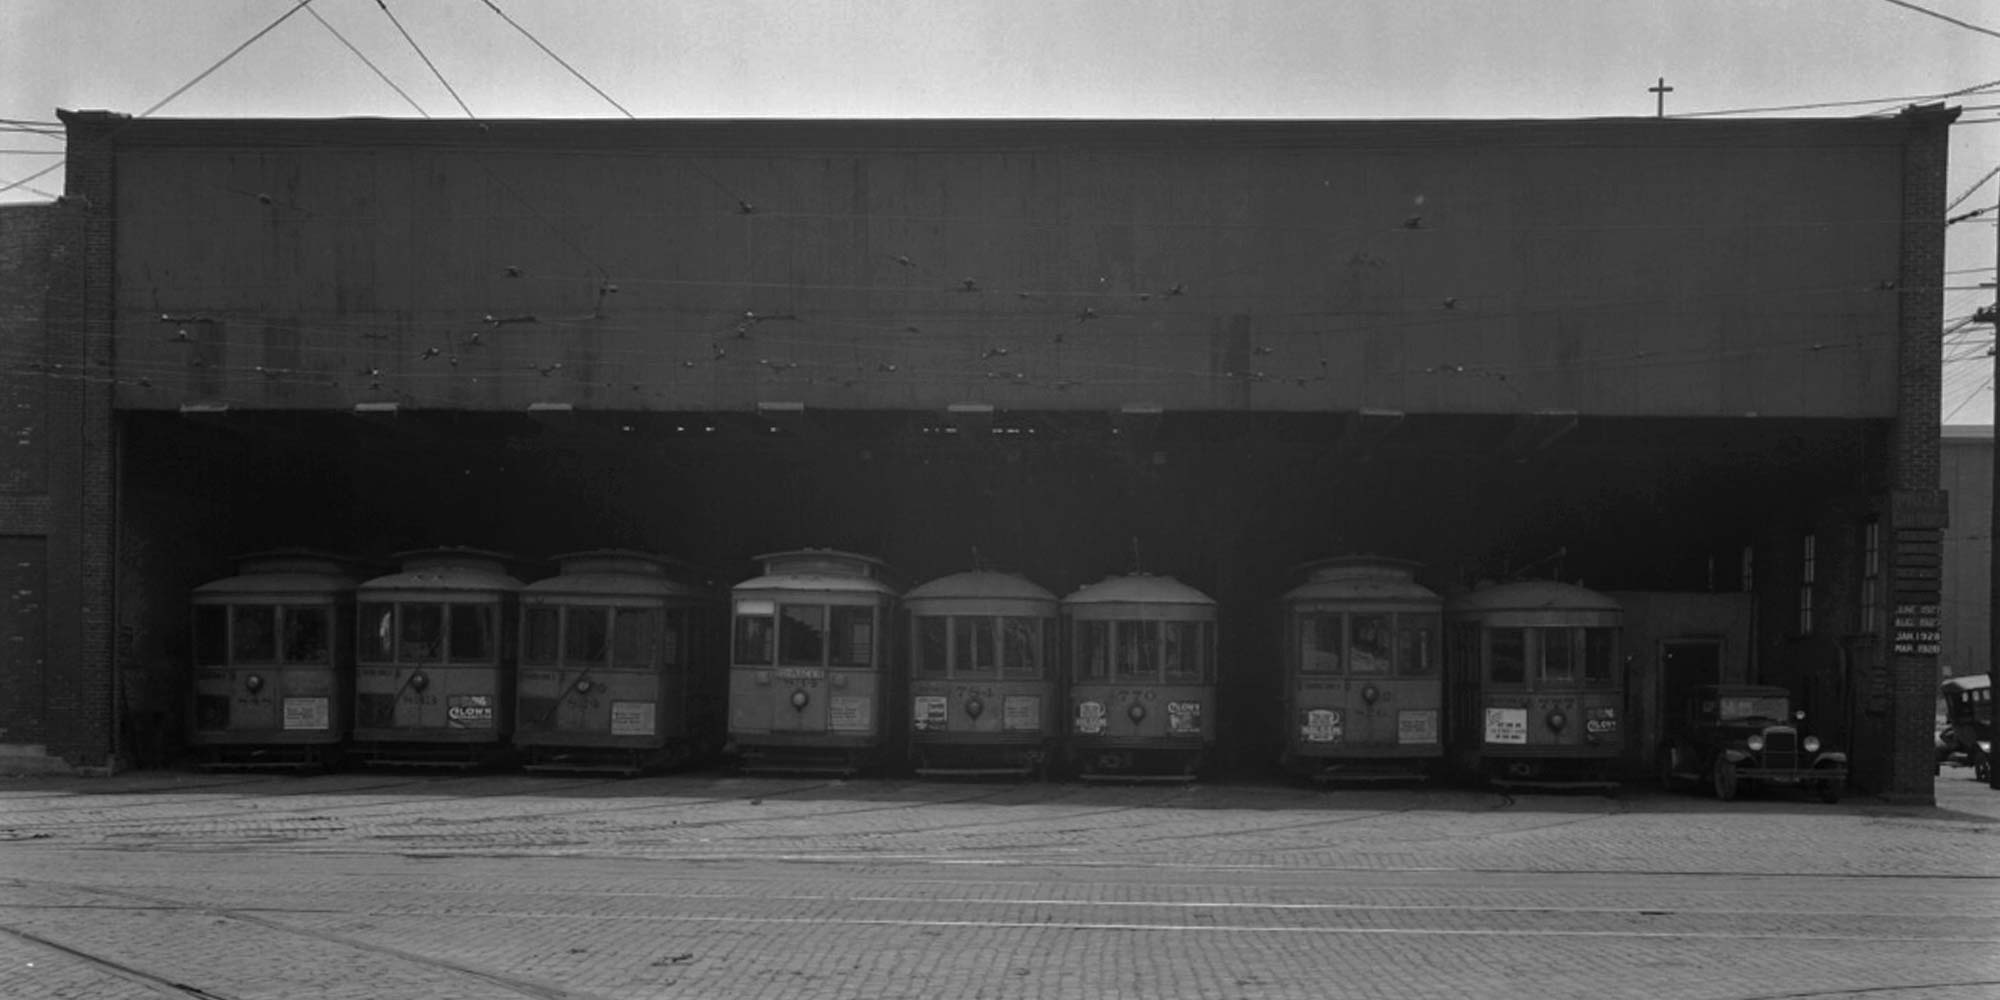
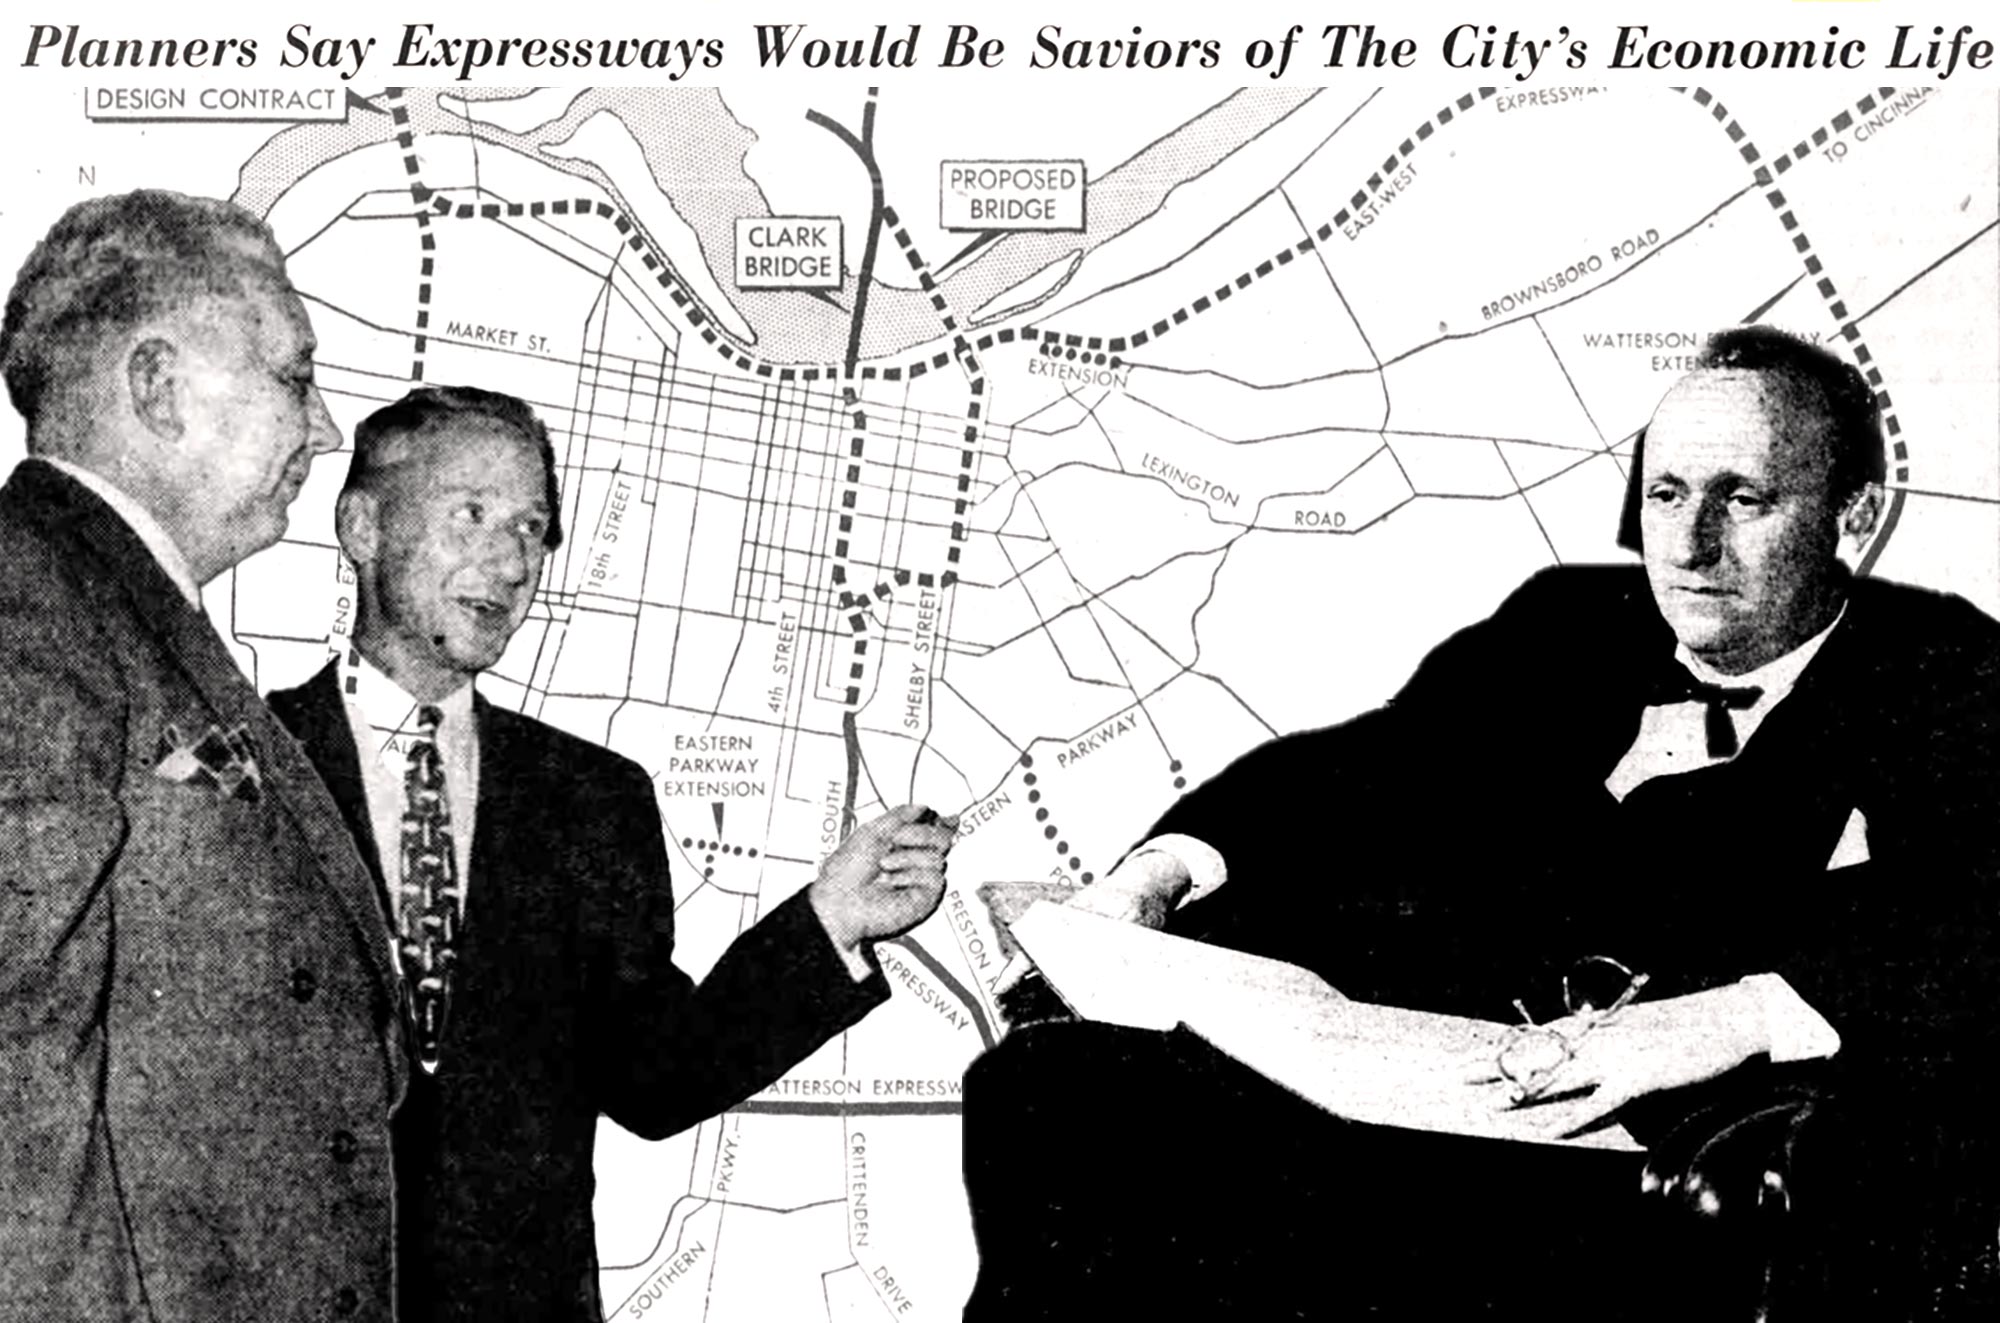
Louisville was no exception to this. This perfect storm of population displacement happened here in the 1930s-1980s. Our slum clearance programs were some of the first in the nation, and began to depopulate some of the most densely populated parts of the city. In 1948, Louisville’s streetcar system closed down for good and access to public transit in the city dwindled more and more. Urban expressways began to split neighborhoods and social ties, followed by the official beginning of urban renewal. These programs would end up demolishing thousands of homes across the city, with those displaced not able to return to the same neighborhood.
As cities began to suburbanize, this came with its own suite of health issues. Car reliance means urbanites are walking less and less and spending more time commuting in a car, increasing risk of obesity, sleep problems, and mental health issues. The cars themselves also pollute in a variety of ways: tailpipe emissions, brake pad dust, microplastics from tires, etc.. You can see the full details of the impact of car reliance in Louisville in one of our previous field notes.
Despite this shift occurring, the details of the change in Louisville are rarely explored. How much has our population density changed? Population density on the census tract level in Louisville goes back to 1950, and the whole county goes back to 1960. These are after the shift in population began, but it can still give us a glimpse of the changes that have occurred over the past 75 years.
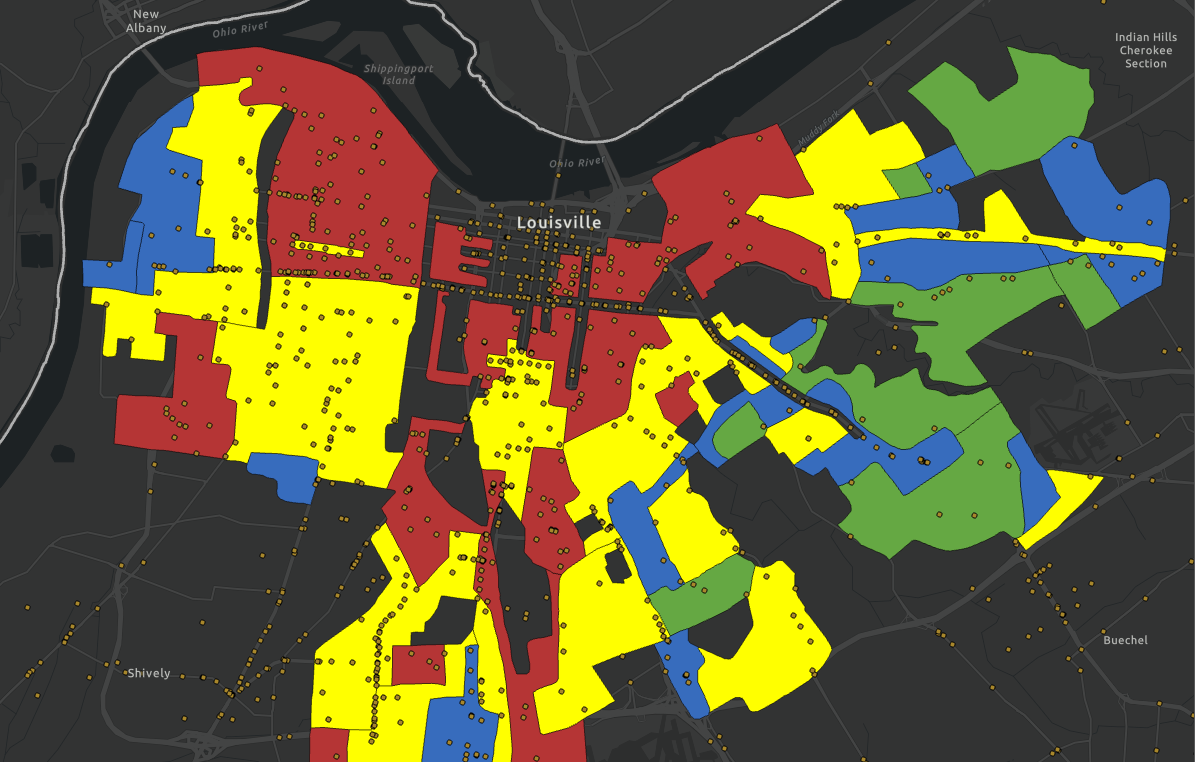
In 1950, Louisville had a population of around 369,000. This is near the peak of the city’s population. For reference, prior to the 2003 merger, Louisville had a population of around 256,000 and it took up more area than it had in 1950. The map below shows the population density of the city at the time.
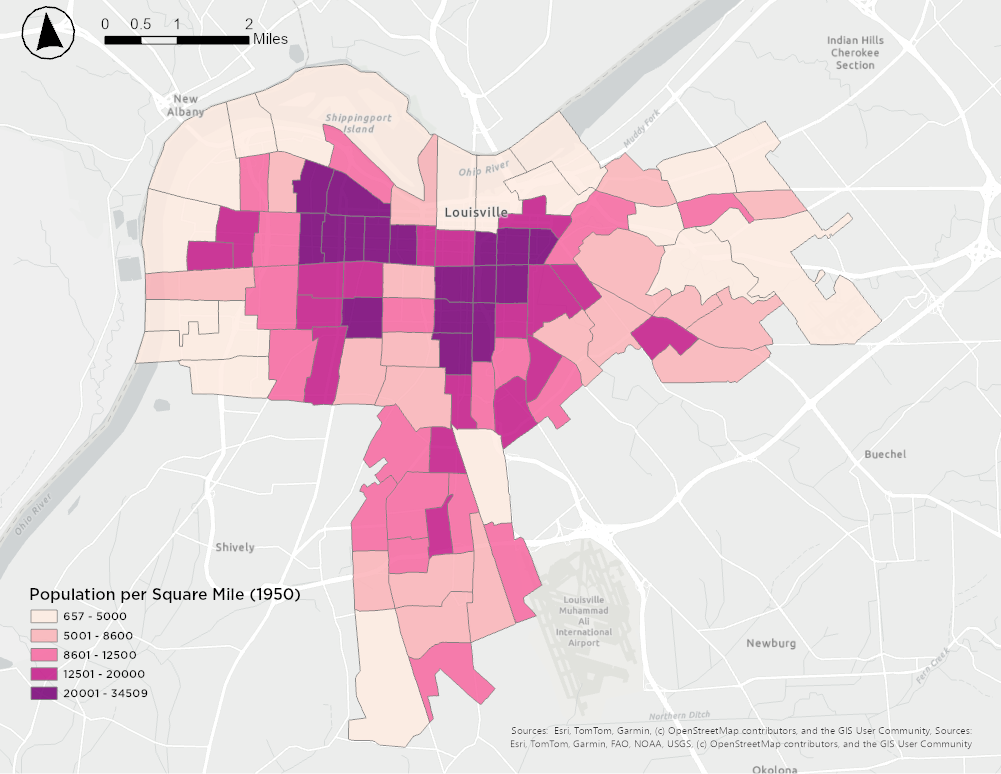
Immediately, we can see a radical change in almost every single part of the city. Of the 90 census tracts, half had over 10,000 residents per square mile back then. Almost all had over 5,000. The densest census tract takes up much of what is now the LOUMED district and parts of Butchertown and Smoketown, and had approximately 34500 people per square mile, a density exceeding that of much of modern Chicago and many parts of New York City. Many of the tracts neighboring downtown exceed 20,000 residents per square mile. City-wide, Louisville had around 8608 residents per square mile compared to around 2,400 now.
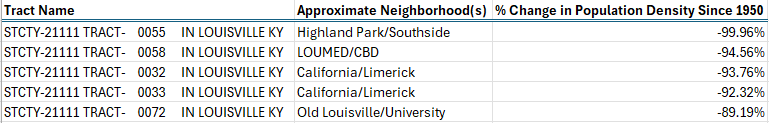
We can also utilize current ACS data and projections from Esri to see the current population density of these same tracts, to look at the percent change since 1950. Across the whole city (at the time), population density in these tracts has decreased by 46% on average. Population density decrease is as high as 99%, in the case of some tracts/neighborhoods. The chart below shows the top 5.
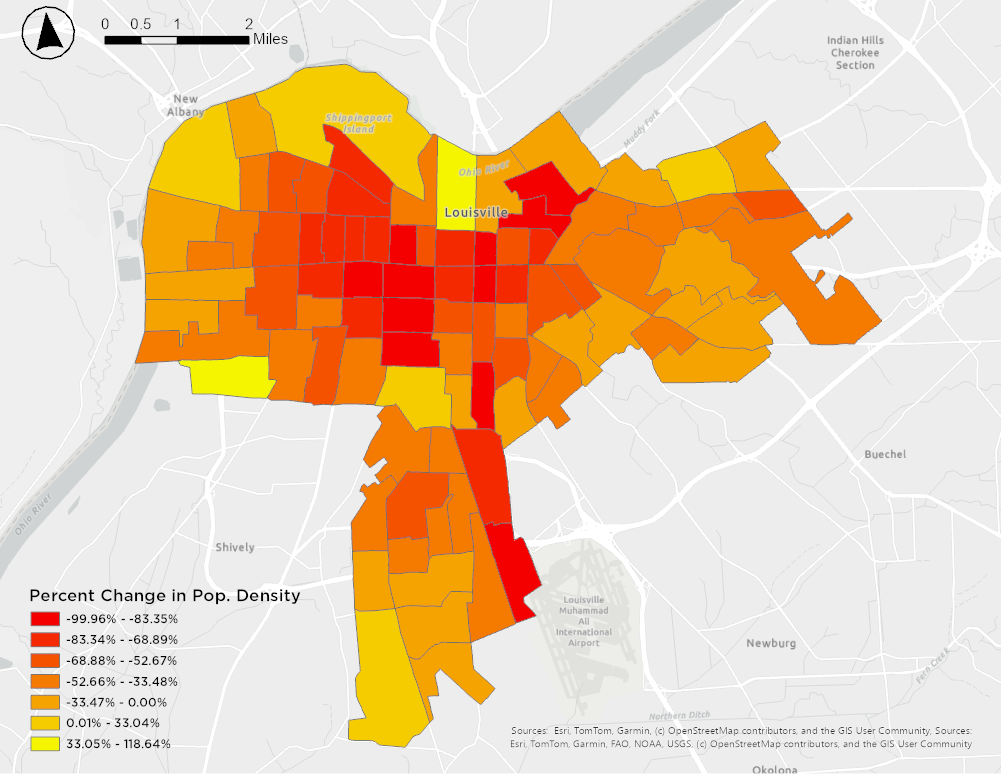
The map below shows all the tracts and their percent change in population density. There are some neighborhoods/tracts that have seen minimal change since 1950; parts of Chickasaw, Crescent Hill, Cherokee-Seneca, and Shawnee have seen change only in the single digits. Most other tracts saw a substantial decrease in density, with only a handful seeing an increase. Ironically, downtown north of Liberty saw a big increase in density, over 100%.
1960 would see further population change, but it is the first year to have data for the whole of Jefferson County. This gives us a more apt comparison to modern day Louisville. Below is the overall population density map in 1960.
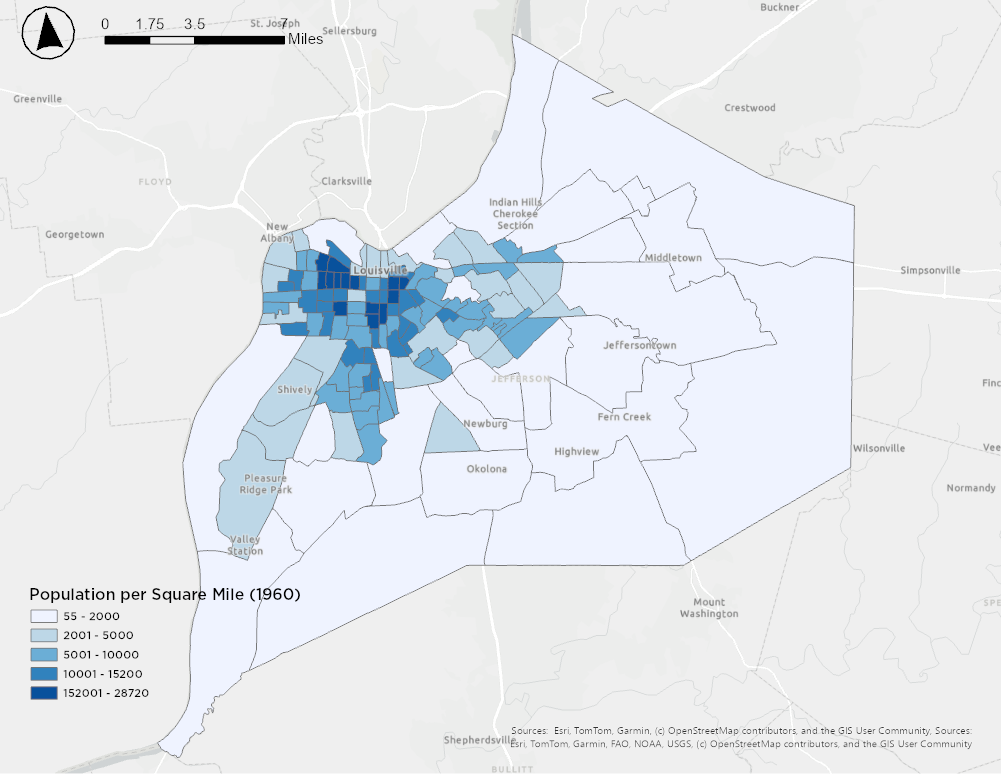
This paints a relatively similar picture to 1950, with the additional context of the suburbs being included. Pretty much all the neighborhoods that were population dense in 1950 remain so, although you can see the peak density has decreased by about 6,000 residents per square mile. Areas surrounding downtown still tend to be the densest. The suburban regions of Jefferson County were very unpopulated at this point, with pretty much all the suburban cities having a population density under 2000 per square mile. Most of the movement of Louisvillians since the 1960s has been towards the suburbs, though, so the percent change in density should show much larger changes (positively and negatively) than 1950.
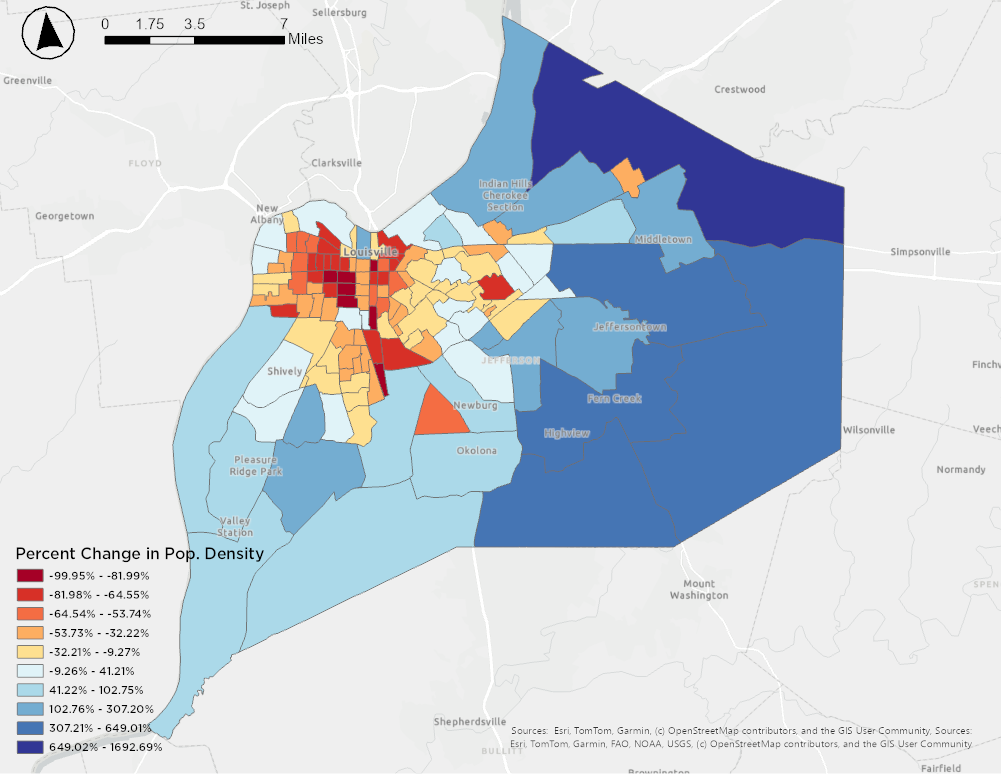
The changes are so stark, that the symbology from 1950 wouldn’t even work on this map. In addition to parts of the city losing almost the entirety of their population between 1960 and 2025, the explosive growth of the suburbs is very evident. Many parts of the outer county had population density measured in the low-mid hundreds of people per square mile, and have since increased to several thousand per square mile. The most extreme example is the tract near Oldham County, which had only 102 residents per square mile in 1960 and now has almost 2000. The only parts of the urban core to see density increases are downtown north of Liberty (again), parts of Portland, parts of Clifton, parts of Shawnee, and portions of Park Hill.
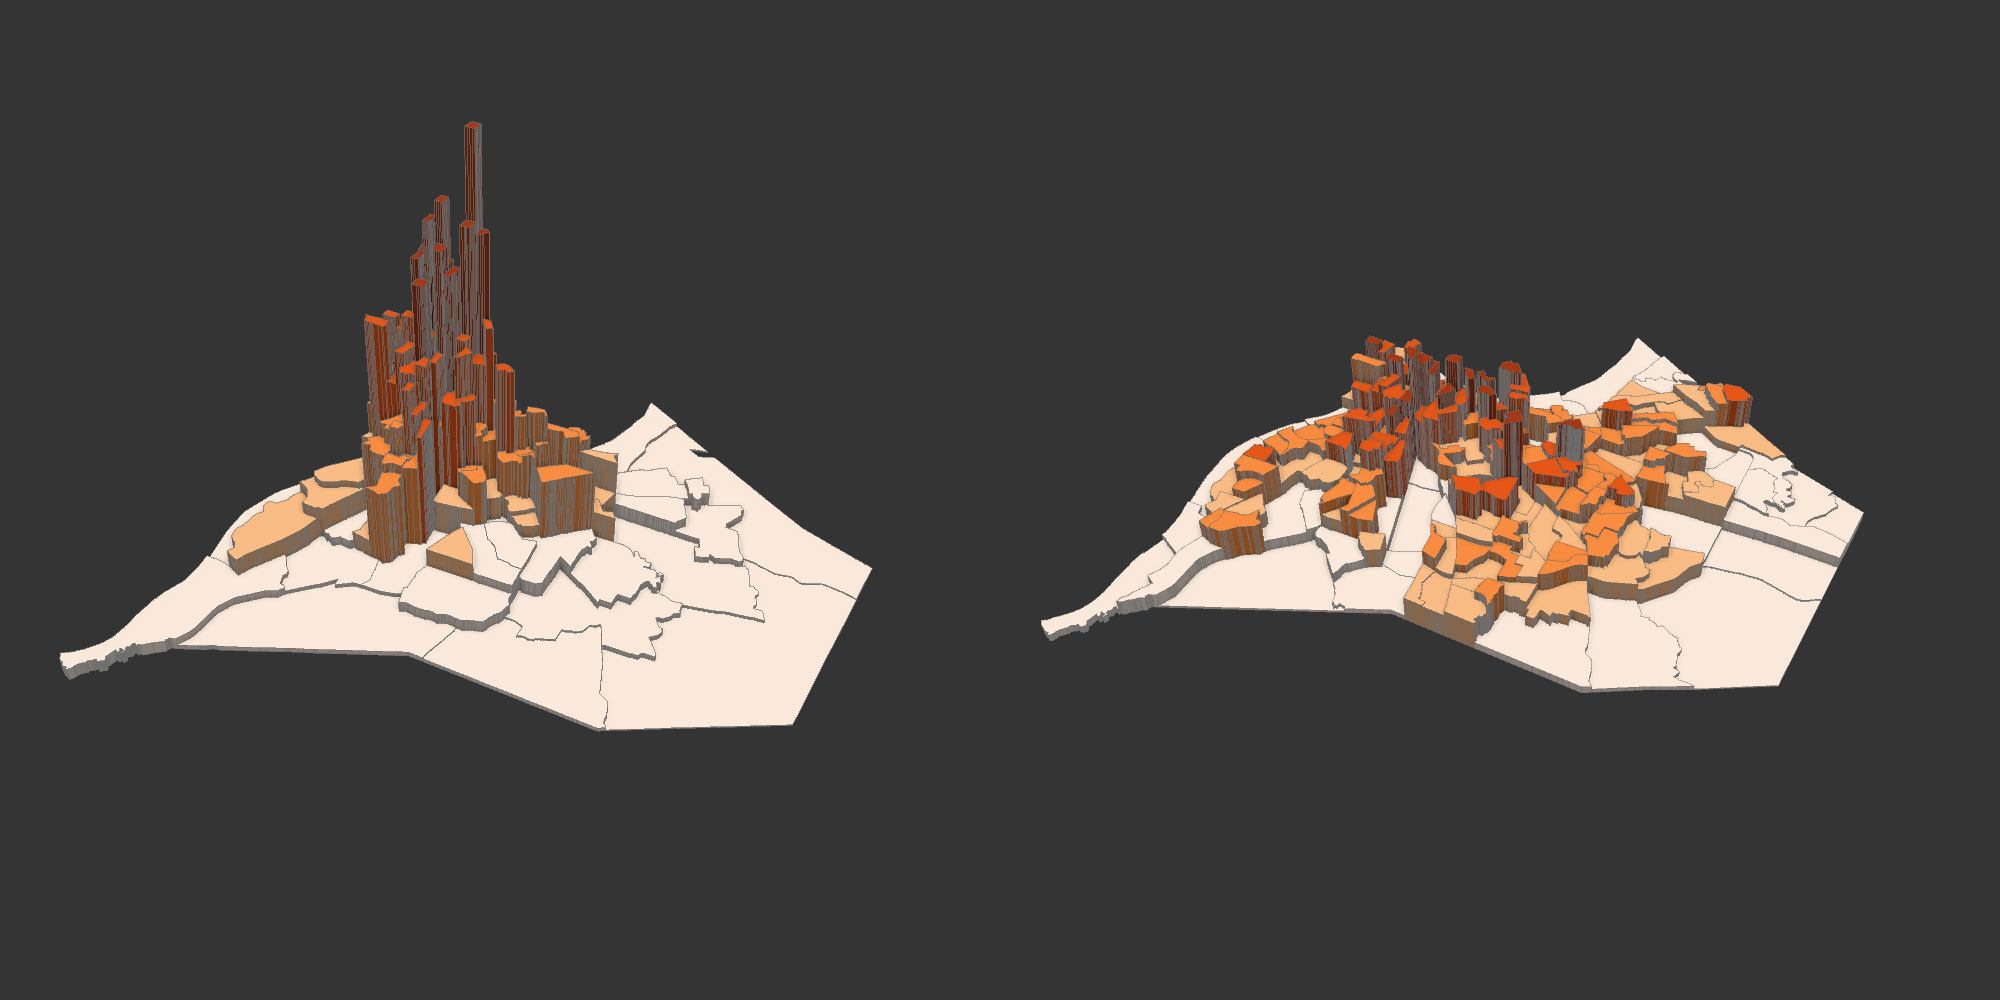
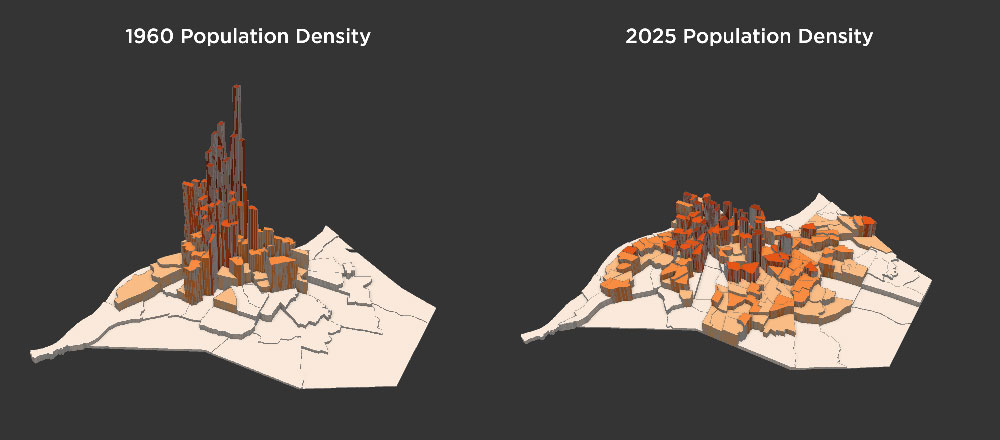
The change in density is particularly striking if you map it out on a 3D map, as seen below. The population towers of downtown have been replaced by a more evenly distributed set of mid-rises.
This may paint a pretty grim picture, but it is important to consider when it comes to urban life and health outcomes. After the suburbanization of recent decades, many cities (including Louisville) have begun to reorient their planning and design towards urban density. The health benefits of doing so have become more apparent, and young people are more and more seeking to move into the inner city (2). It is possible that in the decades we will return to the density levels that were normal only a lifetime ago.