Widespread adoption of e-scooters and bike share programs has led to a radical shift in how people get around. This has led to the new rise of “micromobility”: small, low-speed vehicles usually meant for single passengers. These vehicles can range from skateboards to electric mopeds, although the concept is often associated with bicycles and scooters. Micromobility options have expanded rapidly and are becoming more and more accessible. This has resulted in micromobility reaching its peak use in 2023, when 133 million trips were taken on micromobility devices.
Louisville’s history with micromobility options has been tumultuous to some extent. As bike share programs became more popular nationwide, Louisville adopted its own program in 2017 called LouVelo. Stations were set up in some of the most bikeable areas of town: Old Louisville, UofL’s Belknap campus, downtown, and even across the Big Four Bridge in Jeffersonville. The program was done in partnership with national micromobility firm Cyclehop. The program was shuttered in 2023, after the city decided not to renew the contract with Cyclehop.
The other major component of micromobility in Louisville comes from the e-scooter sharing apps. The active operators of these scooters in Louisville are Bird and Lime. The e-scooters have the benefit of not requiring any infrastructure for their deployment, with them often just being dropped off at sidewalks in important areas of the city. This can also cause controversy, however, as they can often end up littering the sidewalk and blocking pedestrian traffic. In 2019, this led to mass vandalism of some of these scooters.
Luckily, there is quite a bit of data available that lets us assess micromobility demand, safety, accessibility, and so on across the city. Metro has partnered with RideReport to make all data on e-scooter usage in the city available from Q3 of 2019. LouVelo also tracked its own usage before being shut down. We can also look at long-term data on bicycle crashes for a glimpse at safety, although the data format utilized by the Kentucky State Police does not seem to have an analysis code for scooter collisions.
LouVelo Data
LouVelo’s data is the most limited in its applications. LouVelo’s range was essentially limited to its stations, and data is only available for the stations themselves rather than polyline data that shows the trips between stations. Most of the stations were located downtown, with some peppered in Louisville’s urban neighborhoods. During the program's lifespan, 72 thousands trips were taken on LouVelo bikes, reaching its monthly peak in 2019 just before the COVID pandemic. An interactive dashboard created by public works with much of this data can be accessed here.
From the data itself, we can see the most popular stations were all downtown. Of the 72 thousands trips taken, around 48 thousand originated in downtown or NuLu. Eight of the top ten stations in terms of ridership were located in downtown or NuLu. The top ten starting locations were pretty similar to the top ten ending locations, so at first glance it seems the most common use for LouVelo was to move between points in Downtown Louisville. The most common start point and end point was station one, located next to Slugger Field. Adjacency to major attractions is common among the top stations, the next two most used stations were near to Main Street/Yum! Center and the Big Four Bridge.
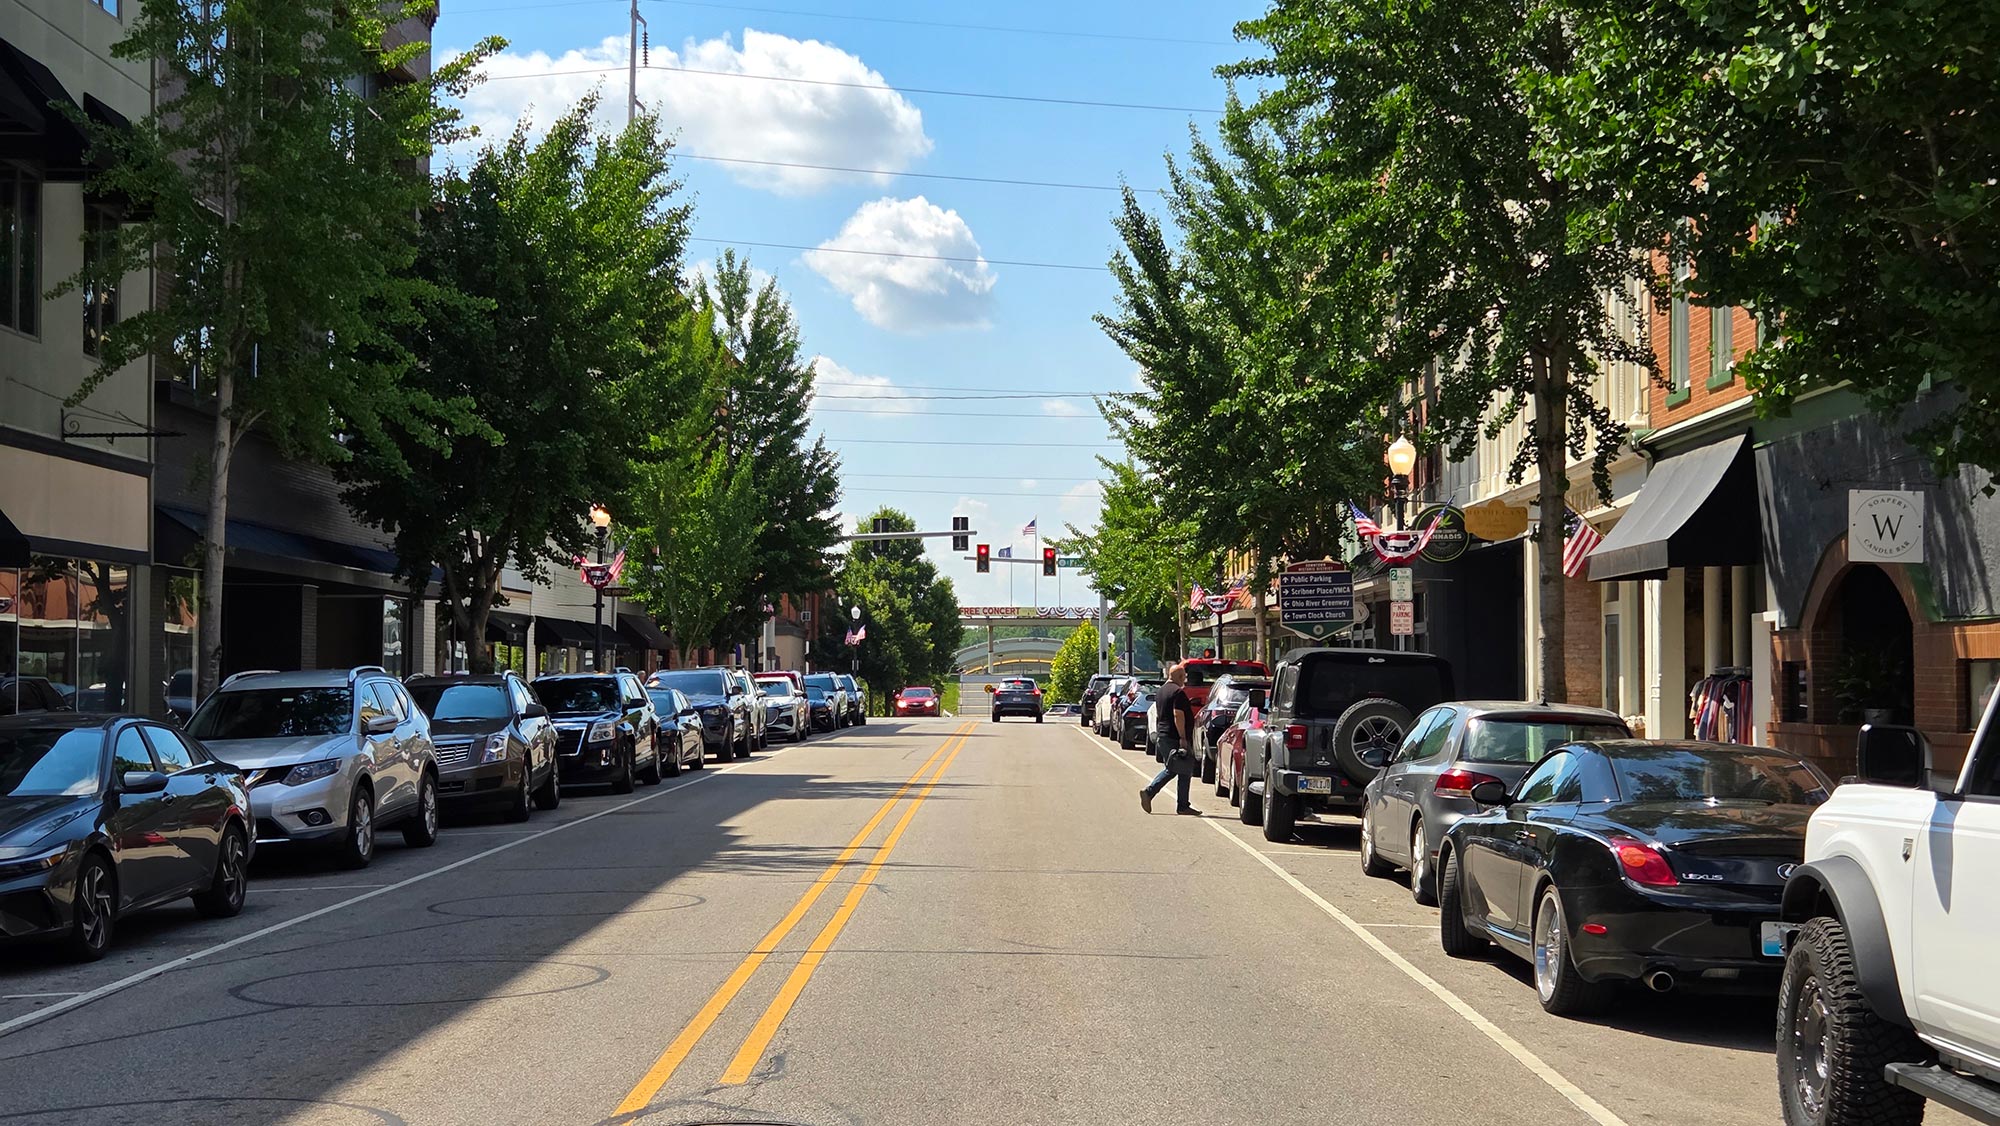
One of the most fascinating parts of this data are the starts and end points and what they may indicate about how LouVelo was used. Many of the most common trips began and ended at the same station, including most of the trips at the most used station at Slugger Field. The 15 most common trips “between” stations were really just starting and ending at the same station; these top 15 return trips take up nearly a third of the overall lifetime trips of LouVelo. This may indicate that many of the trips taken by LouVelo users were purely recreational, or that there is a large error in the data collection process. The most common trip that was not a return to the same station was between Slugger Field and the Jeffersonville side of the Big Four Bridge.

E-Scooter Data
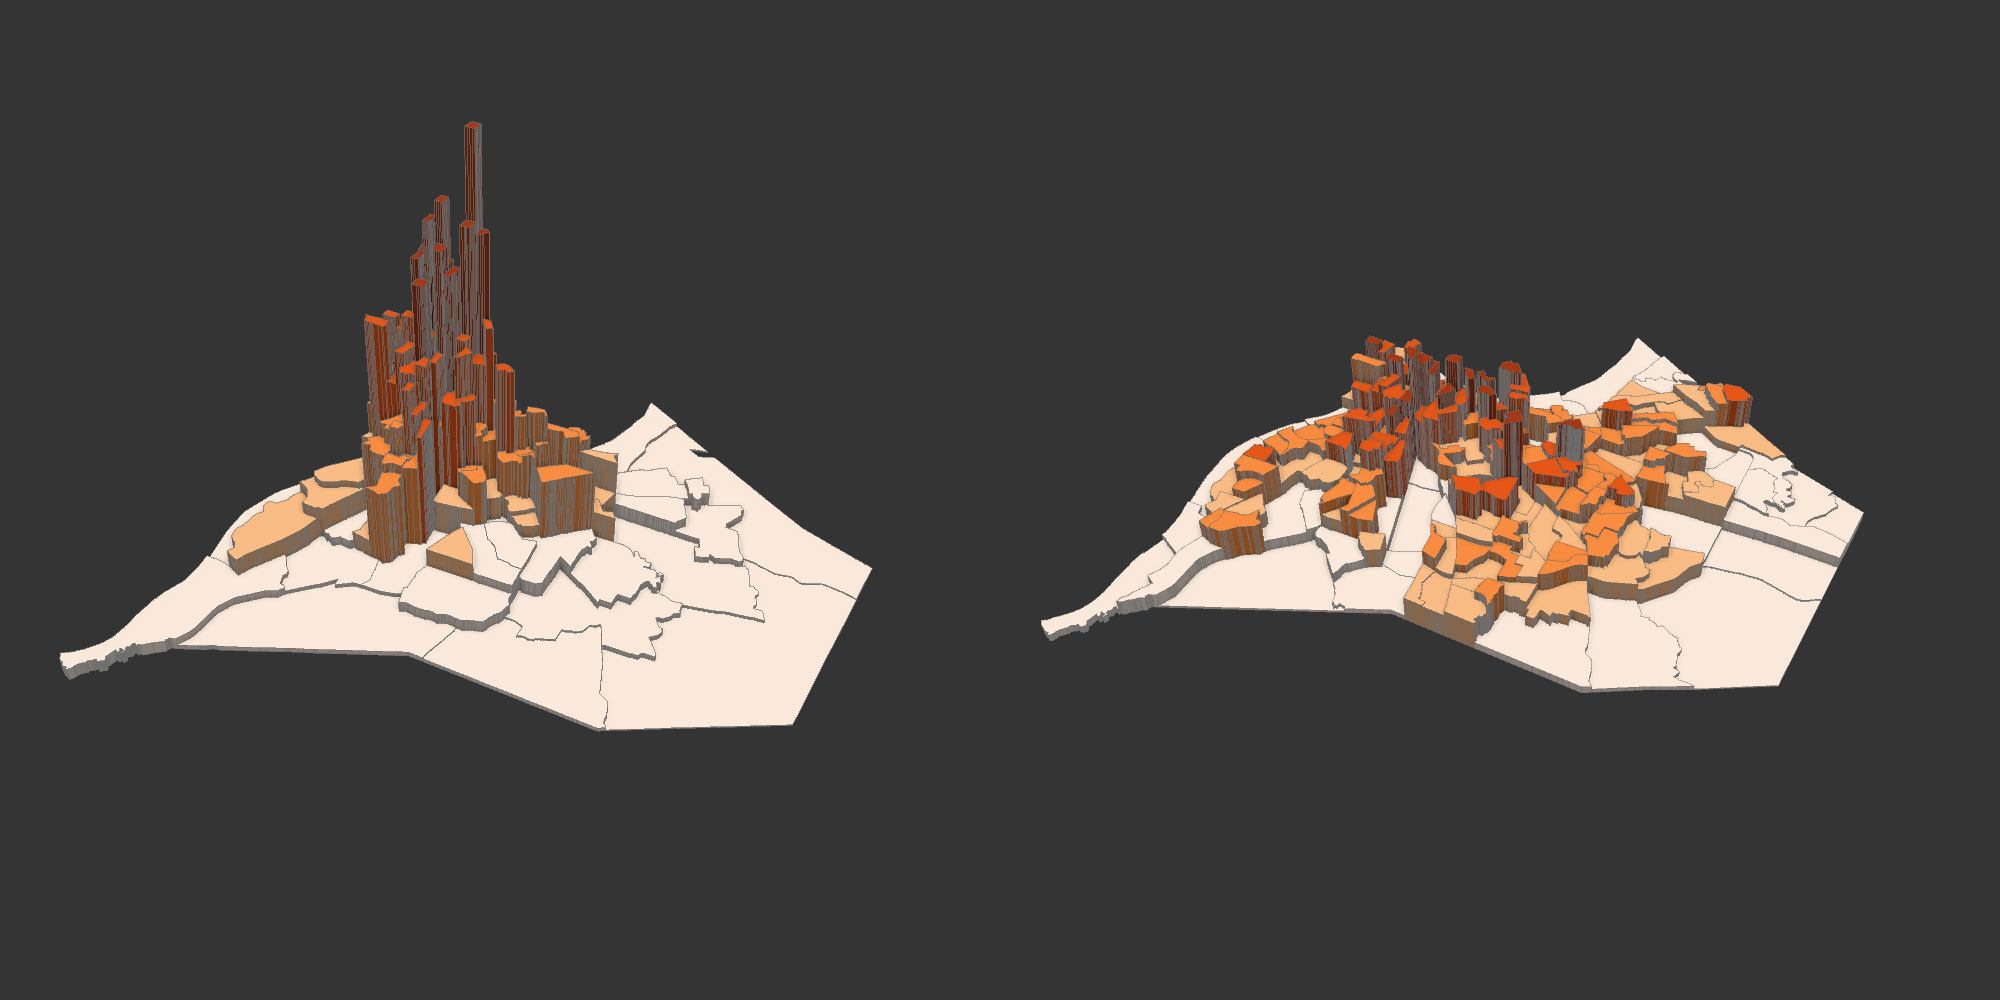
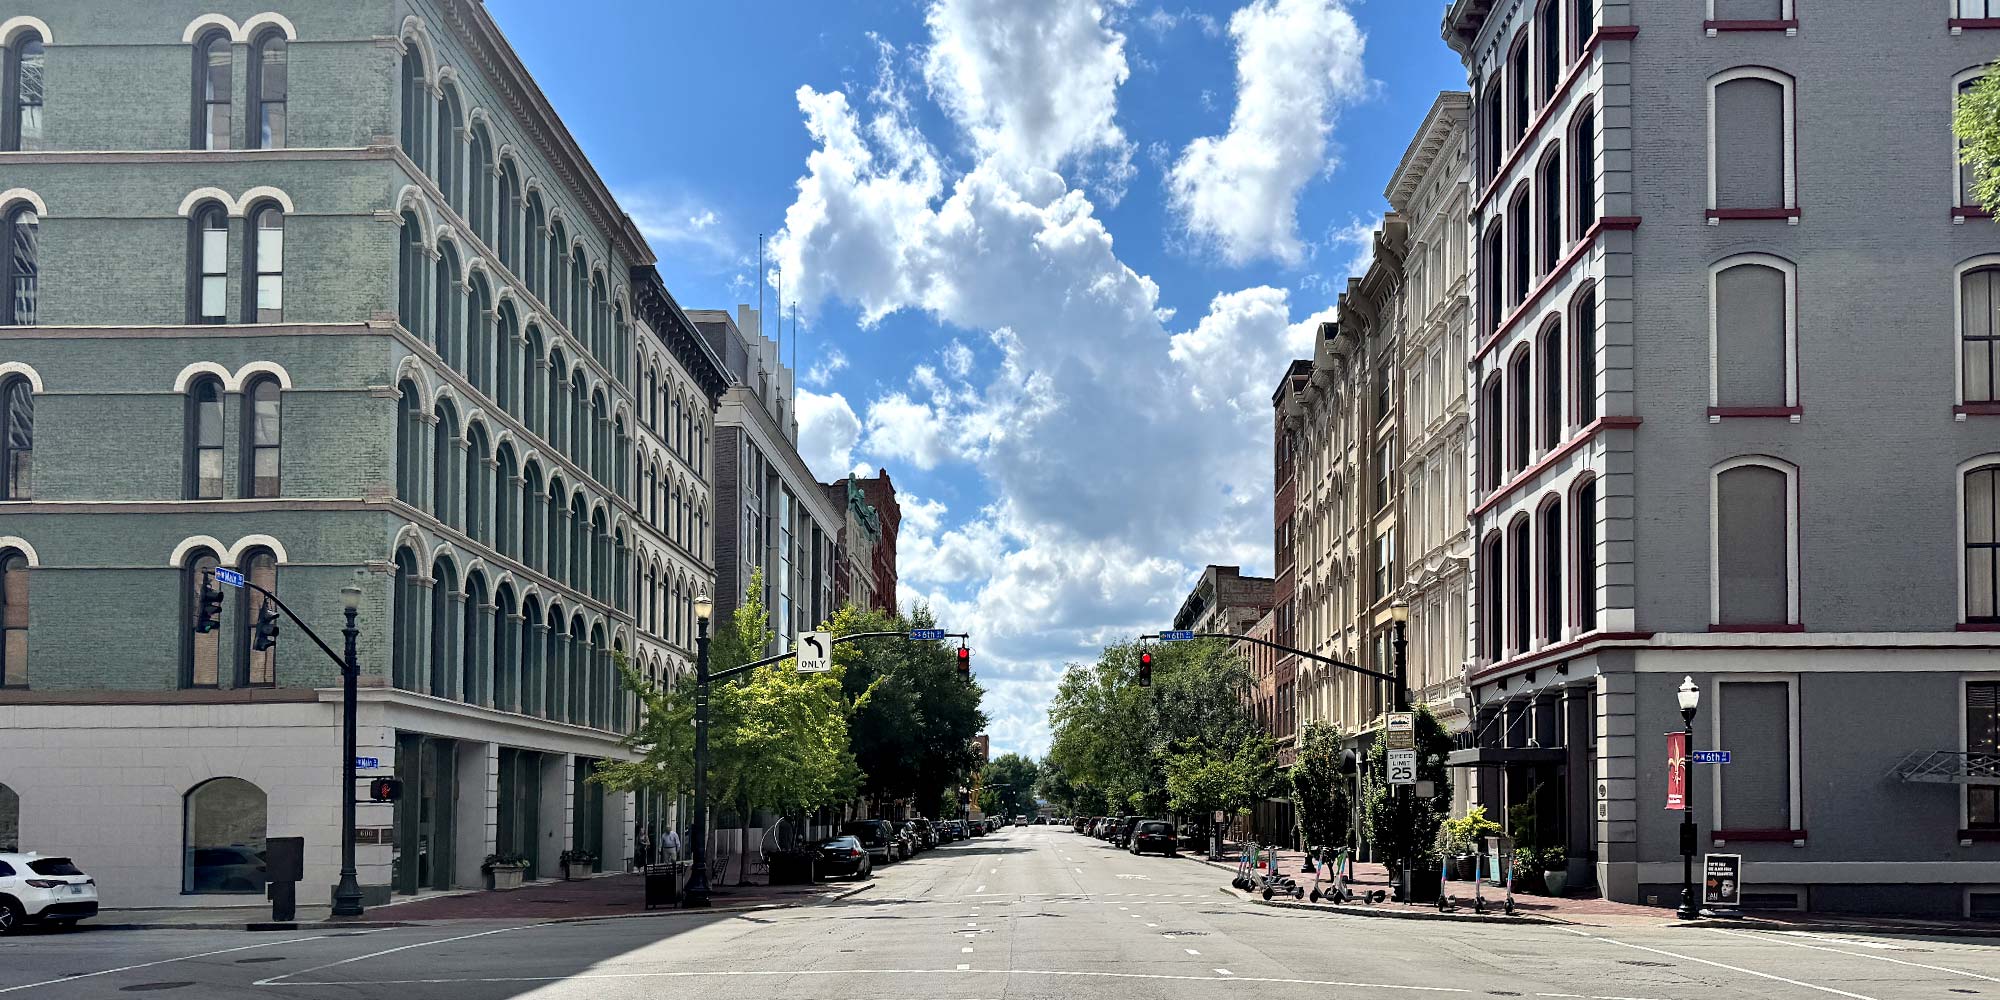
Scooter data is probably the most useful for evaluating trips, as it provides the most data points of any micromobility-related dataset that exists for Louisville. Between September 2019 and April 2025, 1.6 million trips were taken across Louisville. Some road segments, such as Fourth Street between Main and Market, had more e-scooter trips during this timeframe than LouVelo had during its entire lifespan across the city. The data is also quite granular, being able to track scooter locations onto multi-use trails, park paths, and other areas beyond the road network. This allows us to get a good glimpse at demand, connections between neighborhoods, and so on.
It is pretty clear, without even manipulating the data, that the e-scooters are the most well utilized downtown, near UofL, and around Bardstown Road. This mirrors the station locations for LouVelo pretty well, although they had relatively few stations close to Bardstown Road. This data allows us to see some smaller micromobility hotspots outside of the areas where LouVelo was stationed. Thousands of trips went deep into West Louisville, and several hundred went as far south as Iroquois Park.

The primary hotspots identified for e-scooter use (Downtown, UofL Belknap Campus, and Bardstown Road) provide insights into how these areas connect. Dedicated bike lanes are also often used by micromobility devices, so the presence of bike lanes are generally important for encouraging micromobility across the board. In the case of downtown and the Belknap campus, the primary micromobility connection between the two areas is Fourth Street. This is in spite of the fact that almost every bike connection between the areas are on other streets with far lower ridership. Third Street nearby is the closest thing to a consistent bike lane between the campus and downtown, but it has half the micromobility ridership of Fourth Street. The Sixth Street “neighborway” that goes all the way from Gaulbert to Kentucky also has significantly lower ridership than Fourth Street.
Micromobility Collisions
The Kentucky State Police collect crash data from every local police department in the state. This data is all accessible for the public, and geocodable. This data contains analysis codes that allow you to look at different collisions based on specific circumstances. Two of these codes are for bicycle collisions, so we can create some kind of map for areas where there may be issues with micromobility safety. Sadly, there is no analysis code or any other datapoint that would allow us to look at e-scooter collisions but bicycles are also a type of micromobile vehicle and function as a decent proxy.
A heat map of bicycle crashes can be useful but also paint a false image. A general lack of dedicated bicycle infrastructure in Louisville means that cyclists may congregate in certain areas they feel safer more often. This means a heat map may just show where people are biking, as they do not even bother going to the unsafe areas. With that being said, you can still take away some interesting lessons in Louisville’s case as a surprising number of the hotspots are pretty far away from any kind of separated bike infrastructure. The main example of this is Broadway.
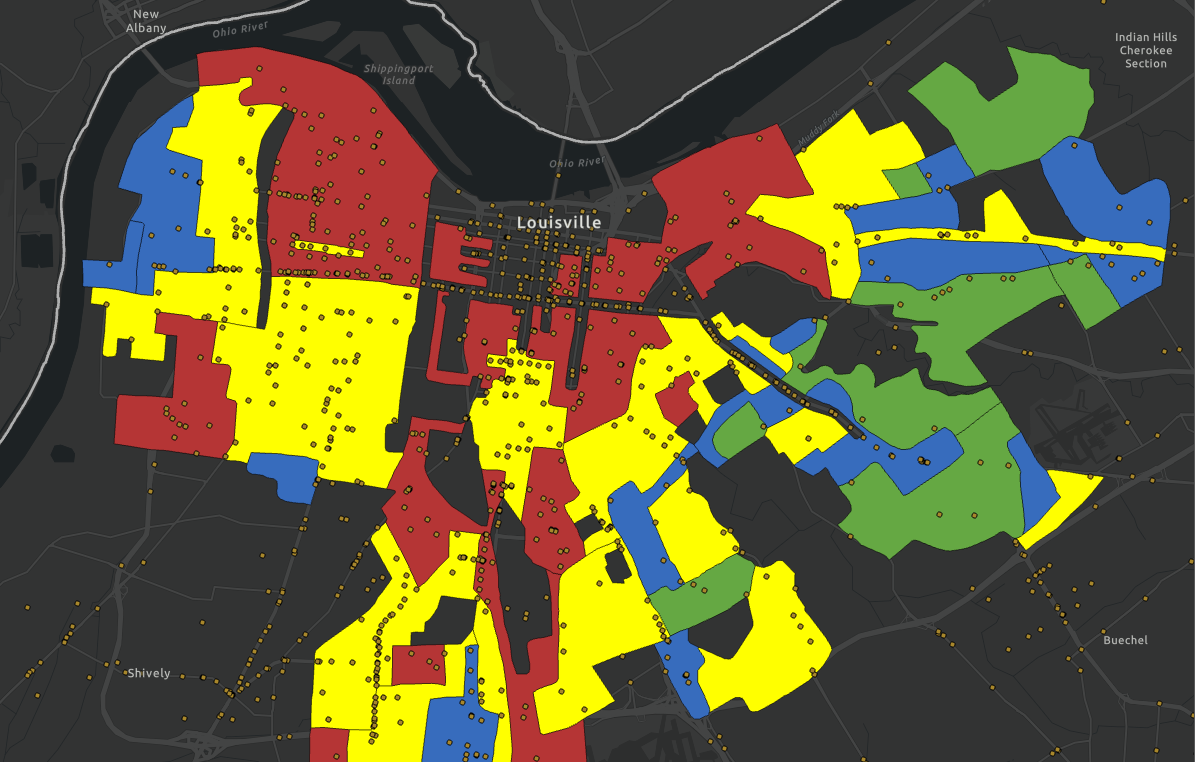
Heat map of Louisville bike collisions, open in another tab here.
The bulk of these collisions are concentrated along major urban thoroughfares without dedicated bike infrastructure. They also tend to happen in intersections rather than somewhere closer towards the midblock. The most common corridors for collisions based on the raw data are Broadway, Dixie Highway, Preston Highway, and Bardstown Road. The issue with looking at the raw numbers is that it does not take into account the length of the corridor. All of the top roadways do have some issues with their design that will make them prone to more collisions, but they are also all some of the longest road segments in the city.
In addition to a traditional heat map, it may be useful to look at high-injury road segments to determine road safety for micromobility. Below is a map of a “high-injury network” of all Louisville roadways. The road data itself comes from LOJIC, which splits the roads into smaller segments by default. This allows us to pick out the road segments with a certain number of bicycle-crash related injuries on them. In this case, that will be three or more.
Cyclist high injury network, open in another tab here.
This provides a good idea of what the hotspots are without some of the issues that can arise from a traditional heat map. Certain intersections and road segments immediately pop out as problem areas. The biggest source of collisions in the city is at Second and Broadway, where two large urban roads meet and neither of them have bike infrastructure. Most of the hotspots in the network fit that description to some extent; it is usually at the intersection of two important, larger roadways that lack separated bike infrastructure or may lack bike infrastructure at all.
Some of these high-injury segments cross over with high-activity segments from the RideReport e-scooter data. This often is the case downtown, with Broadway being both a major source of e-scooter trips and the most major source of bicycle collisions. Outside of downtown, the main overlap is near UofL, where a collision hotspot exists at Fourth and Winkler in an area that is pretty active for e-scooter use.
This mix of data can provide an idea of where targeted solutions may be needed. Many Louisvillians do not want these scooters or any other micromobility devices on the sidewalk, but oftentimes that is the safest place for them to be. Other options existing for the micromobility users can bring them off the sidewalk while keeping them safe in the street. Protected bike infrastructure has been shown to increase safety for all road users, and can enhance safety for micromobility users and pedestrians since they can also be utilized by e-scooter devices. When this is not possible, streets with low traffic and slow speeds also increase safety.