Homelessness has been a consistent problem for the city of Louisville for decades now. Despite efforts from the city government and local nonprofits, homelessness increased 139% last year alone. The Covid-19 pandemic significantly worsened the crisis, but the risk factors that contribute to homelessness are still endemic across the city: lack of affordable housing, lack of access to physical and mental healthcare, stagnant wages, etc.
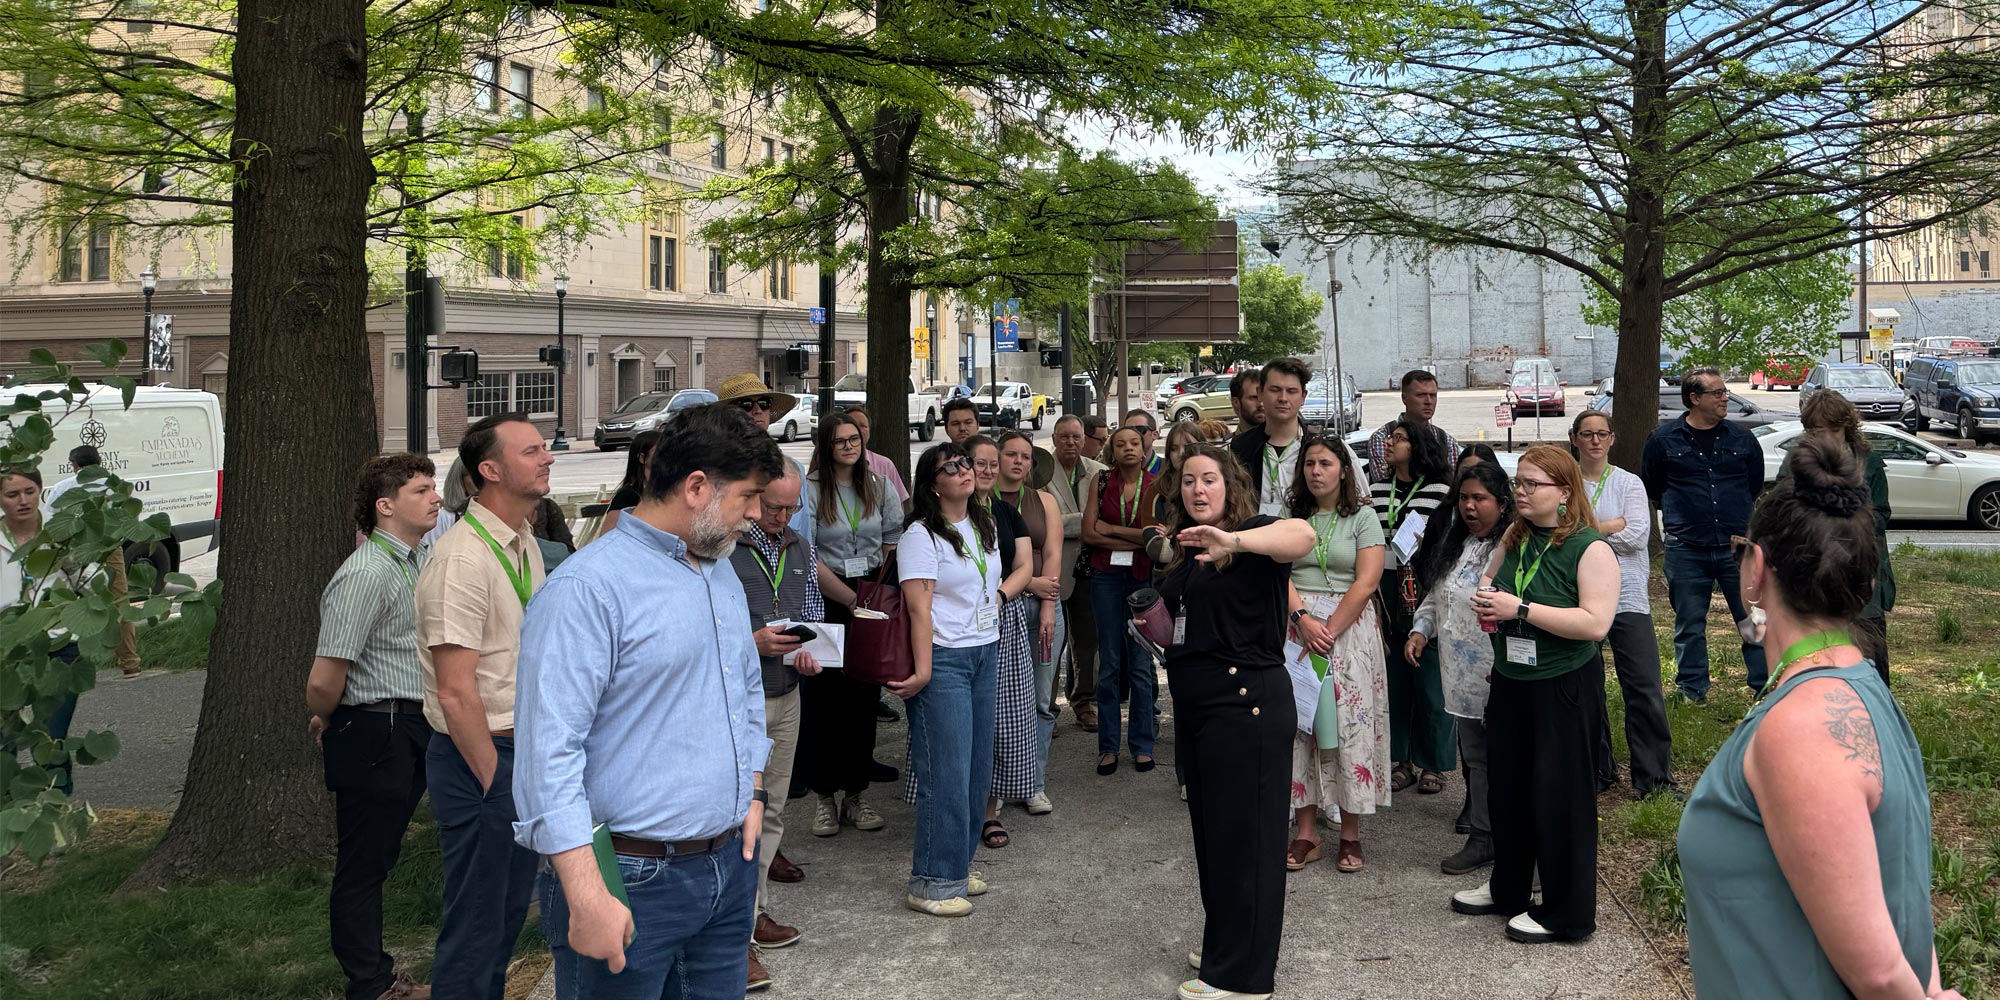
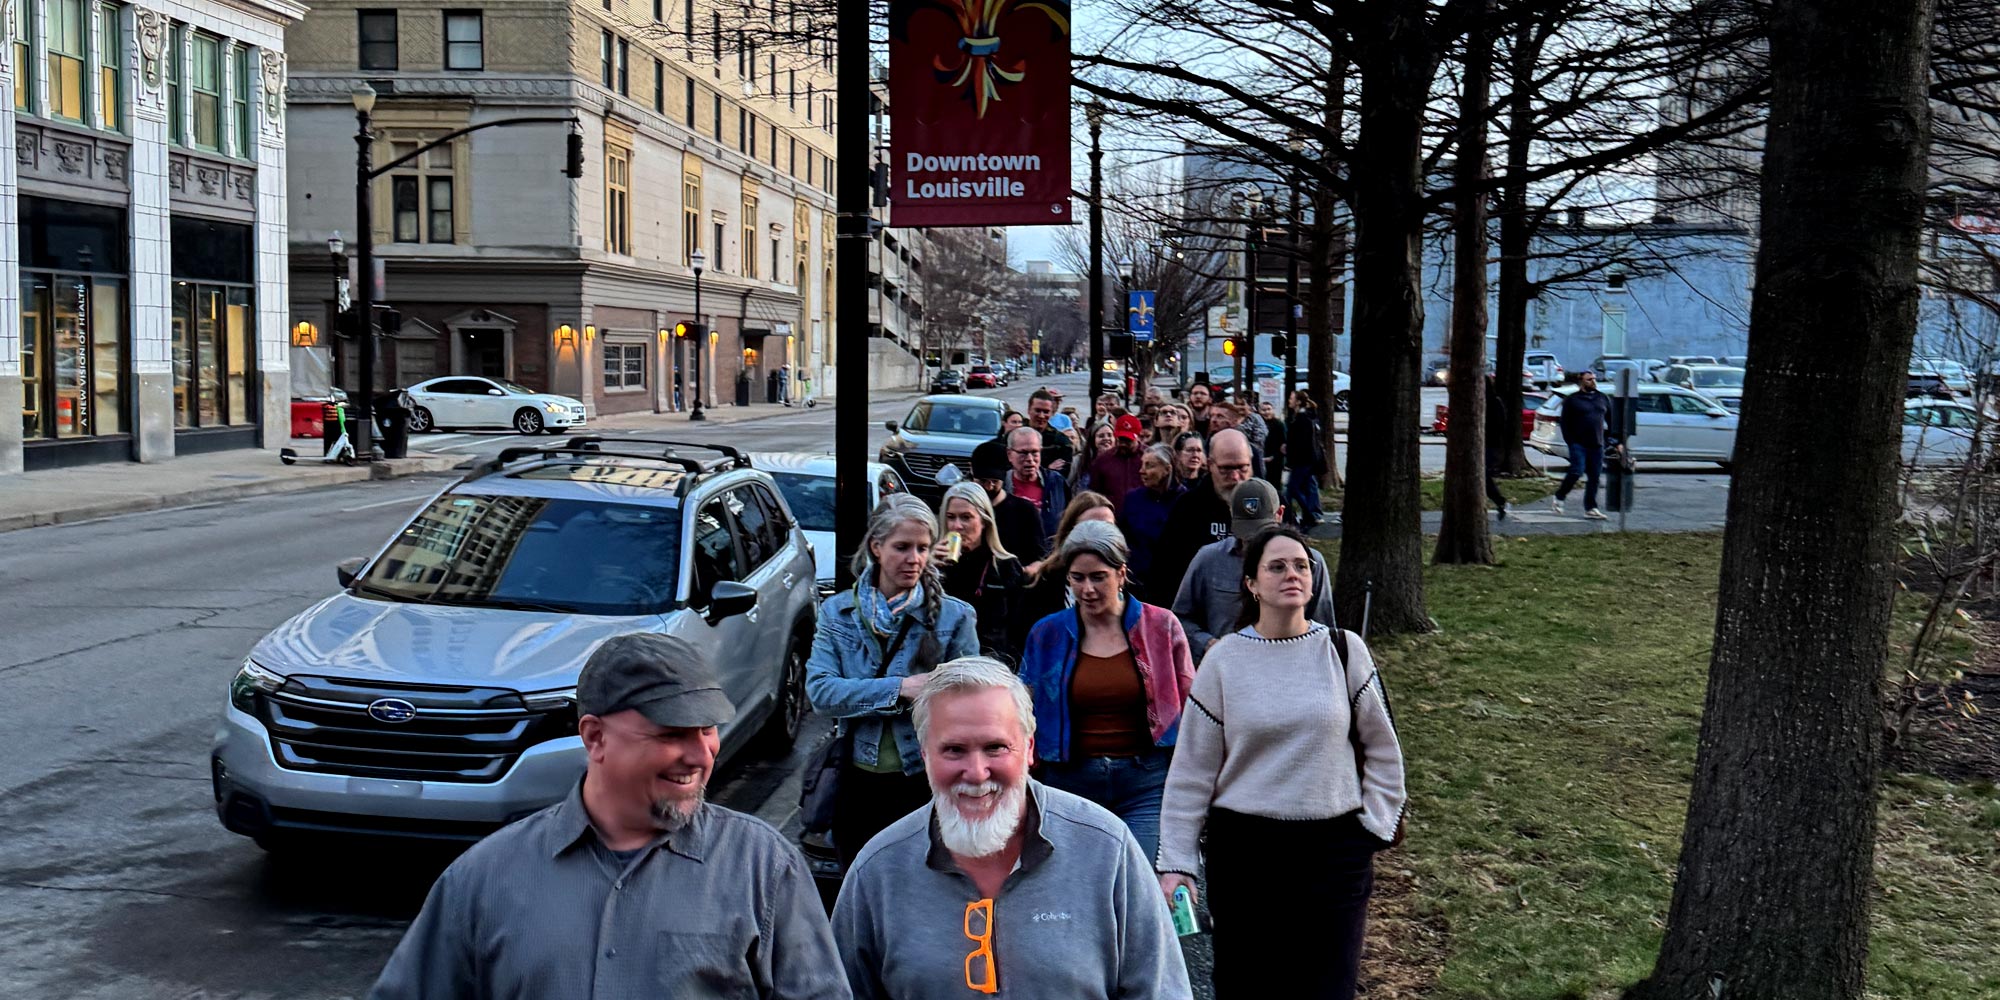
Homelessness has negative effects on mortality, personal health of the homeless, and public health in general (also see here, no paywall). When I recently attended a strategy meeting for the Louisville Downtown Partnership, one of the top issues voted by attendees was the rise of homelessness downtown. This could come from genuine care or that many Americans associate homeless people with crime. Everyone benefits when the issues that cause homelessness are addressed effectively, and a vital part of that is knowing what areas are most at-risk.
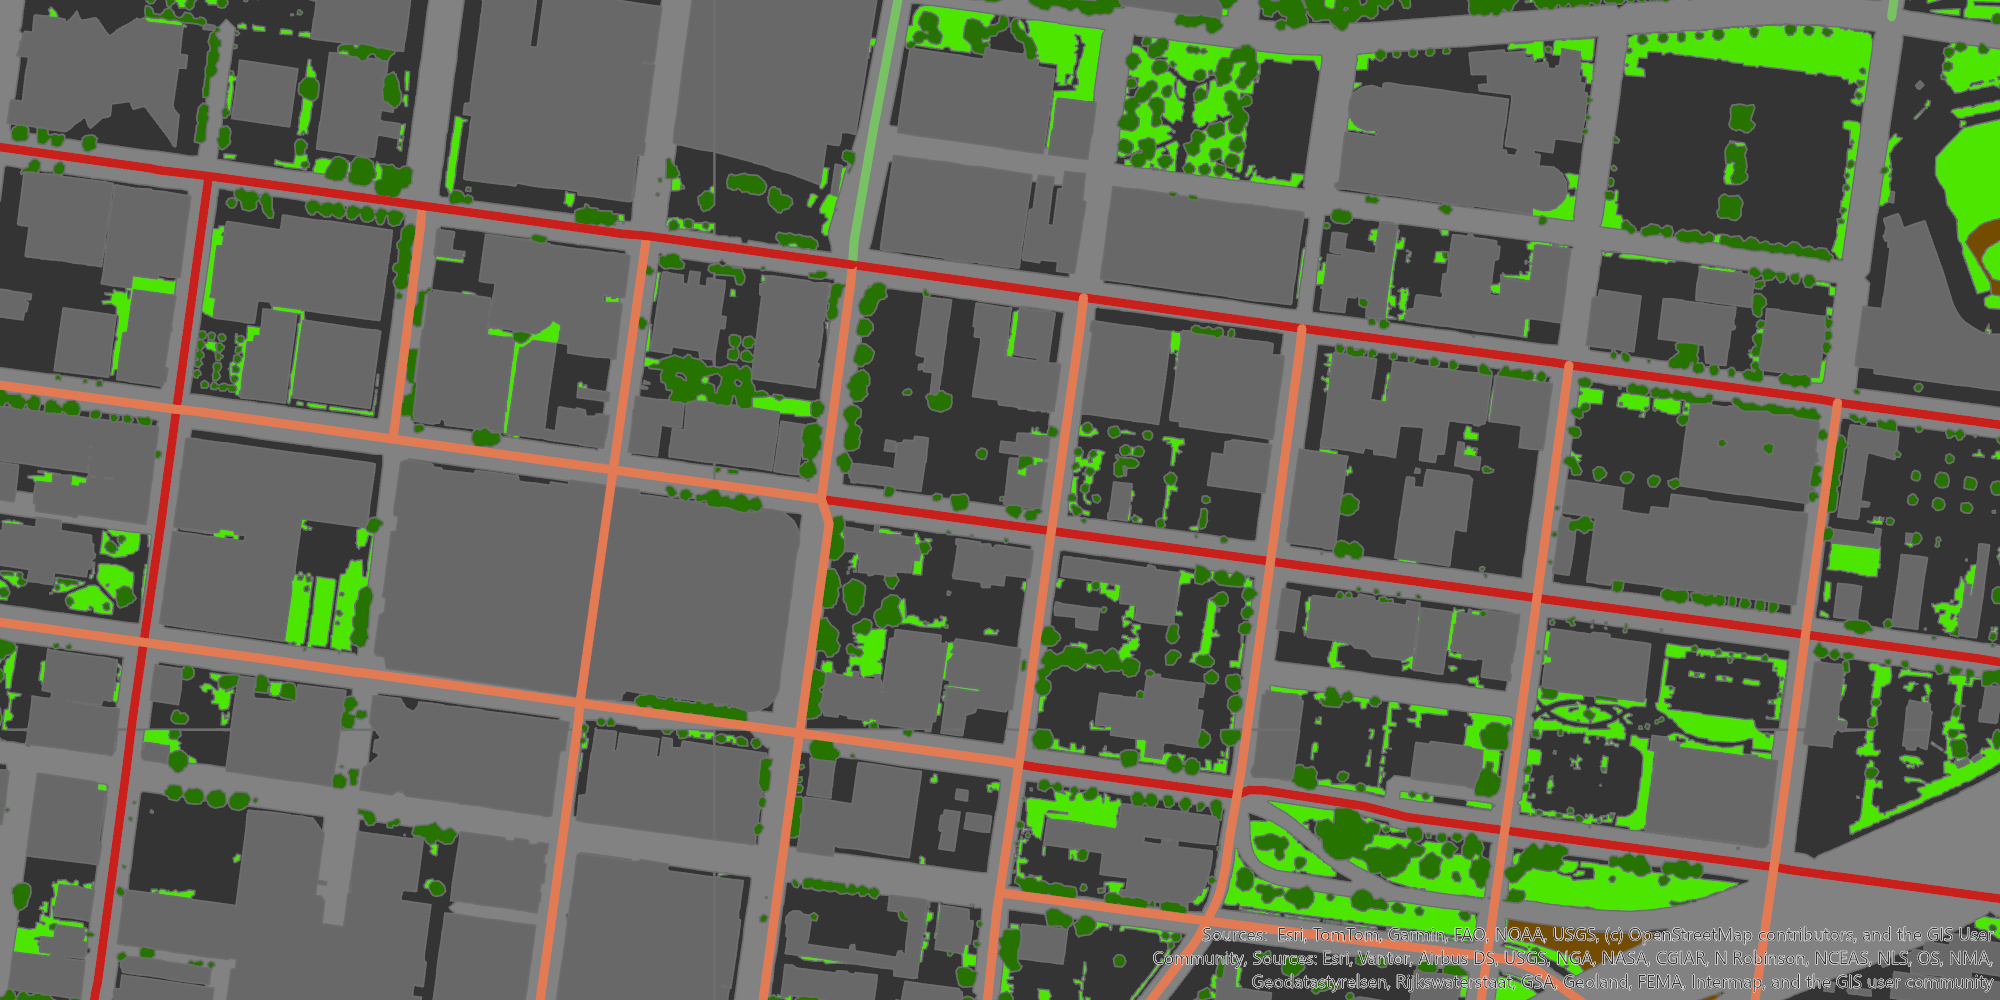
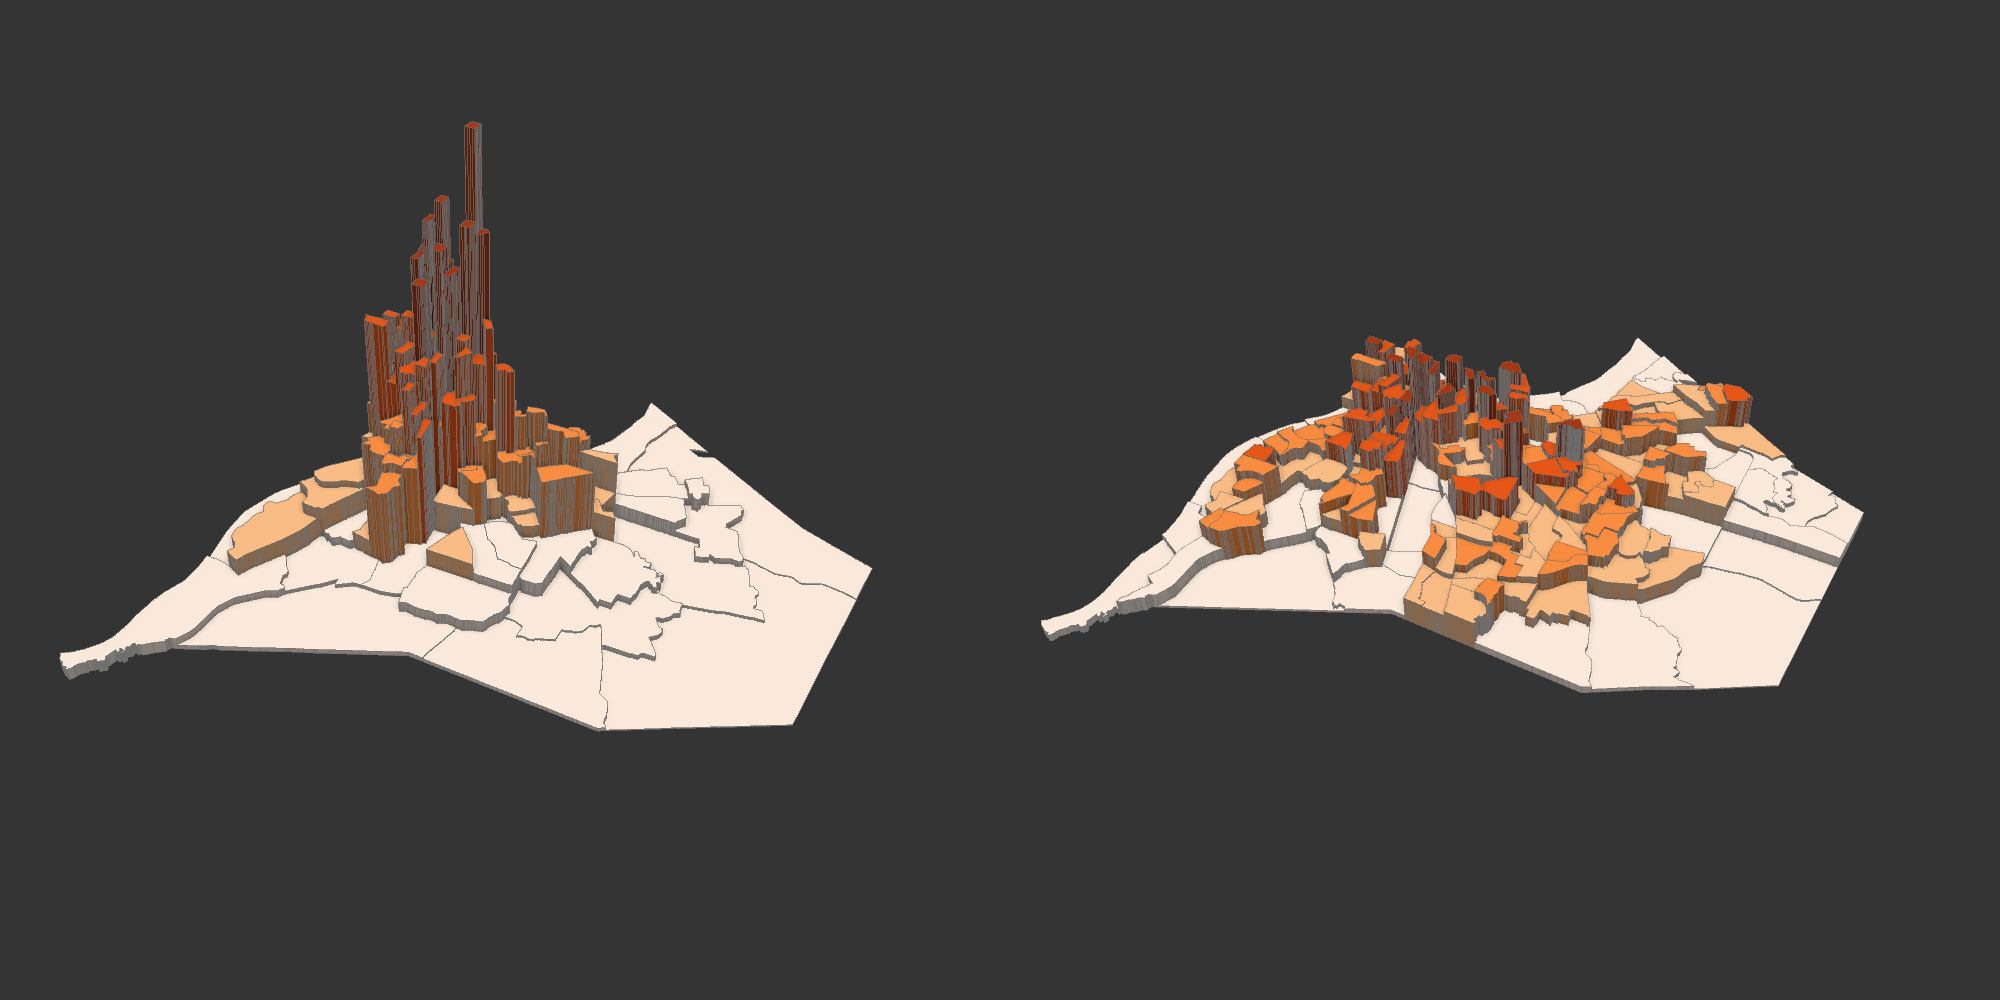
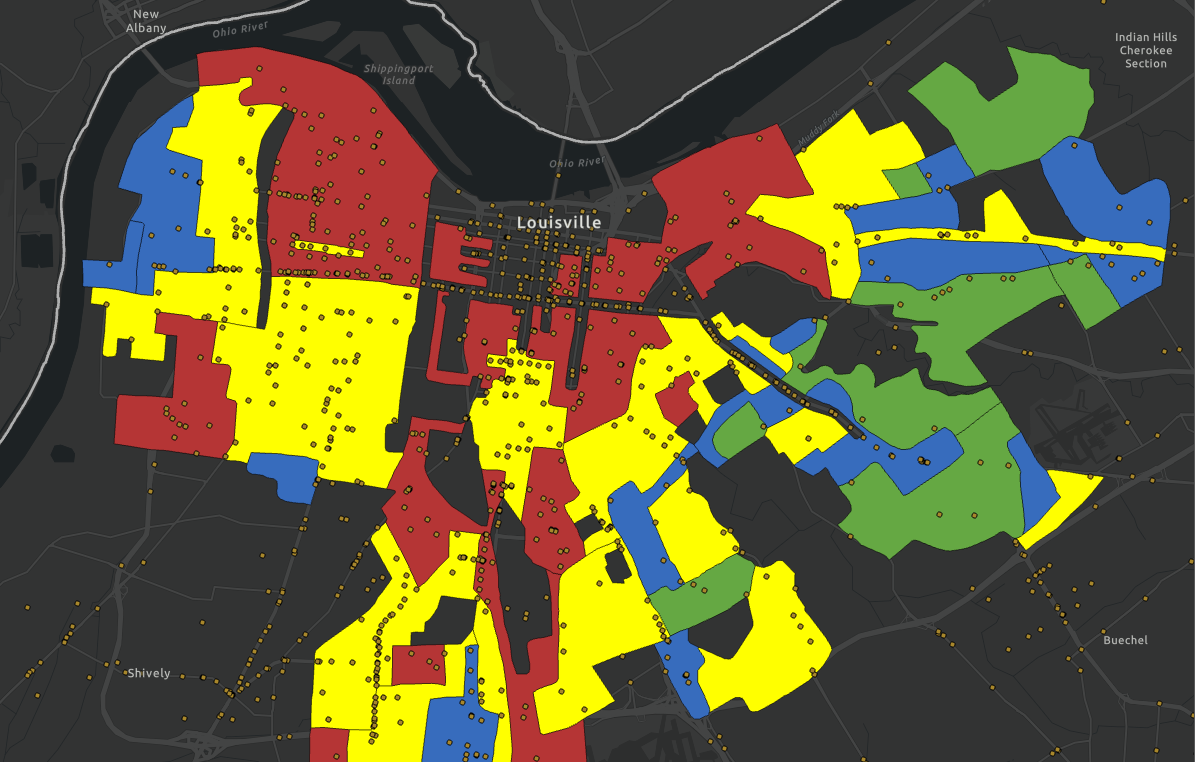
The app below was made to map certain risk factors across Jefferson County. The risk factors include percent of households with 50%+ income going to rent, persons without health insurance coverage, percent of households at or below the poverty line, percent of households using public assistance, percent of persons reporting extensive physical and mental distress, unemployment, along with other economic and health-based factors. This doesn’t include every possible factor that could cause homelessness, but many that have strong effects.
A dummy census tract was made with all the worst possible outcomes for risk factors, which was then used to rank the similarity of every census tract in Jefferson County; the lower the rank, the more at-risk the tract is. The app allows you to click through every tract in the county and see the ten most at-risk ones.
The most at-risk places tend to line up with the west end and areas of the city that were historically redlined. These areas also saw mass amounts of “urban renewal” in the 60s and 70s. They also tend to line up with areas of the city that face the highest eviction rates (thanks to Ryan Massey for pointing this out).