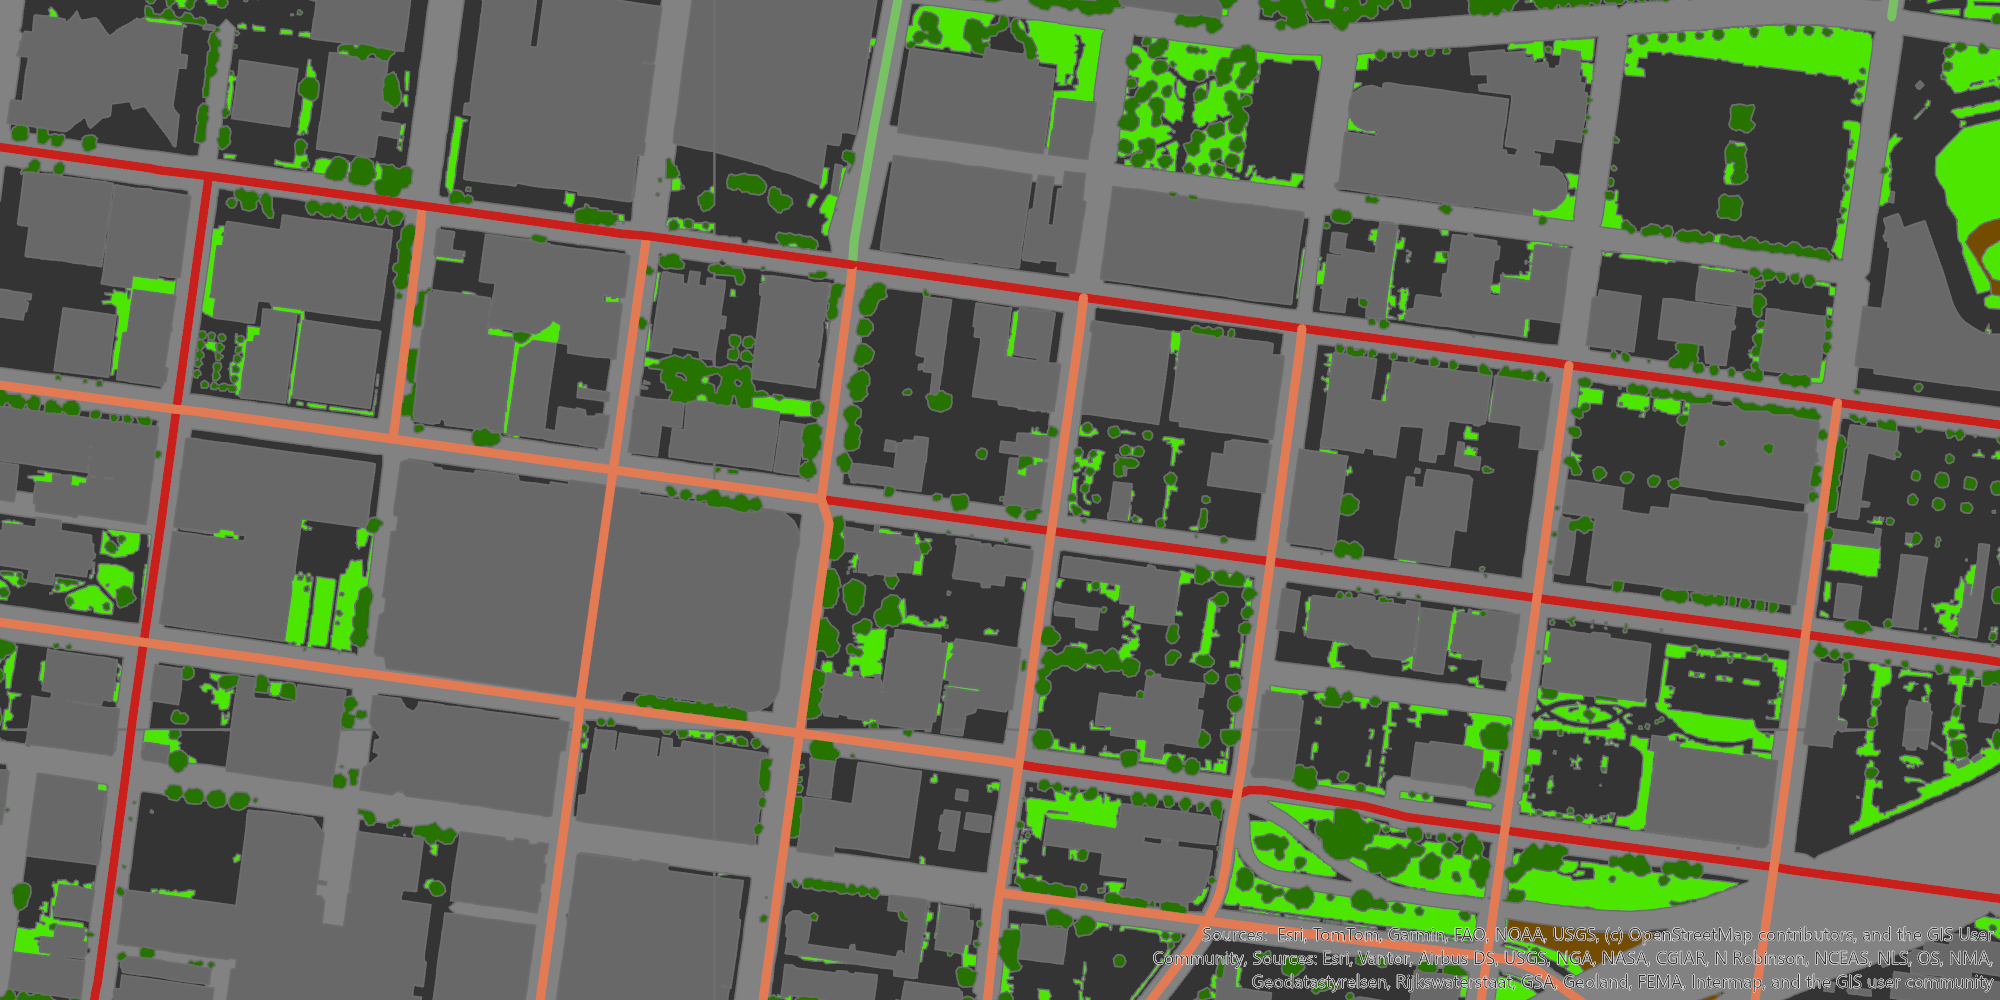
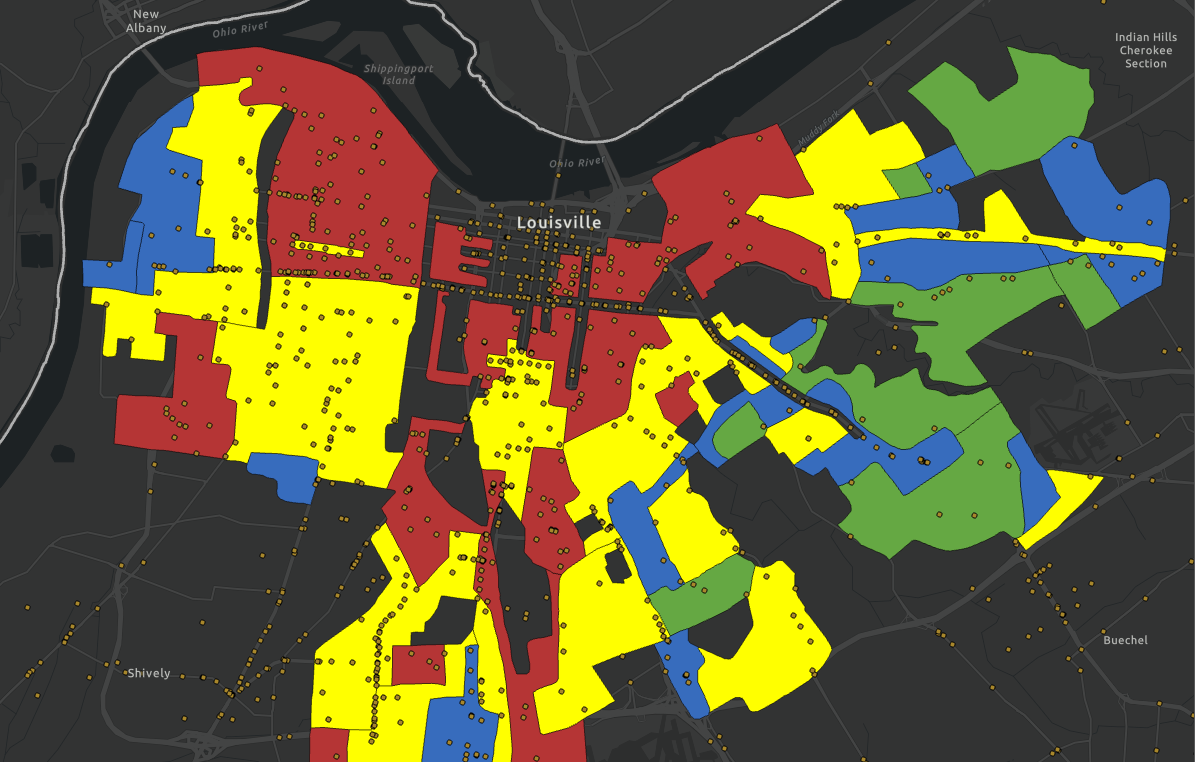
For the past year, the Urban Design Studio has been mapping the activity of people in Founder’s Square. The mapping project follows the model established in the San Francisco Plazas Public Life Study, which tracks basic demographics, location, posture, activities, and presence of vehicles. The results up until June 14th, 2023 were compiled and made into a dashboard, but activity mapping is ongoing and the dashboard will be updated periodically.
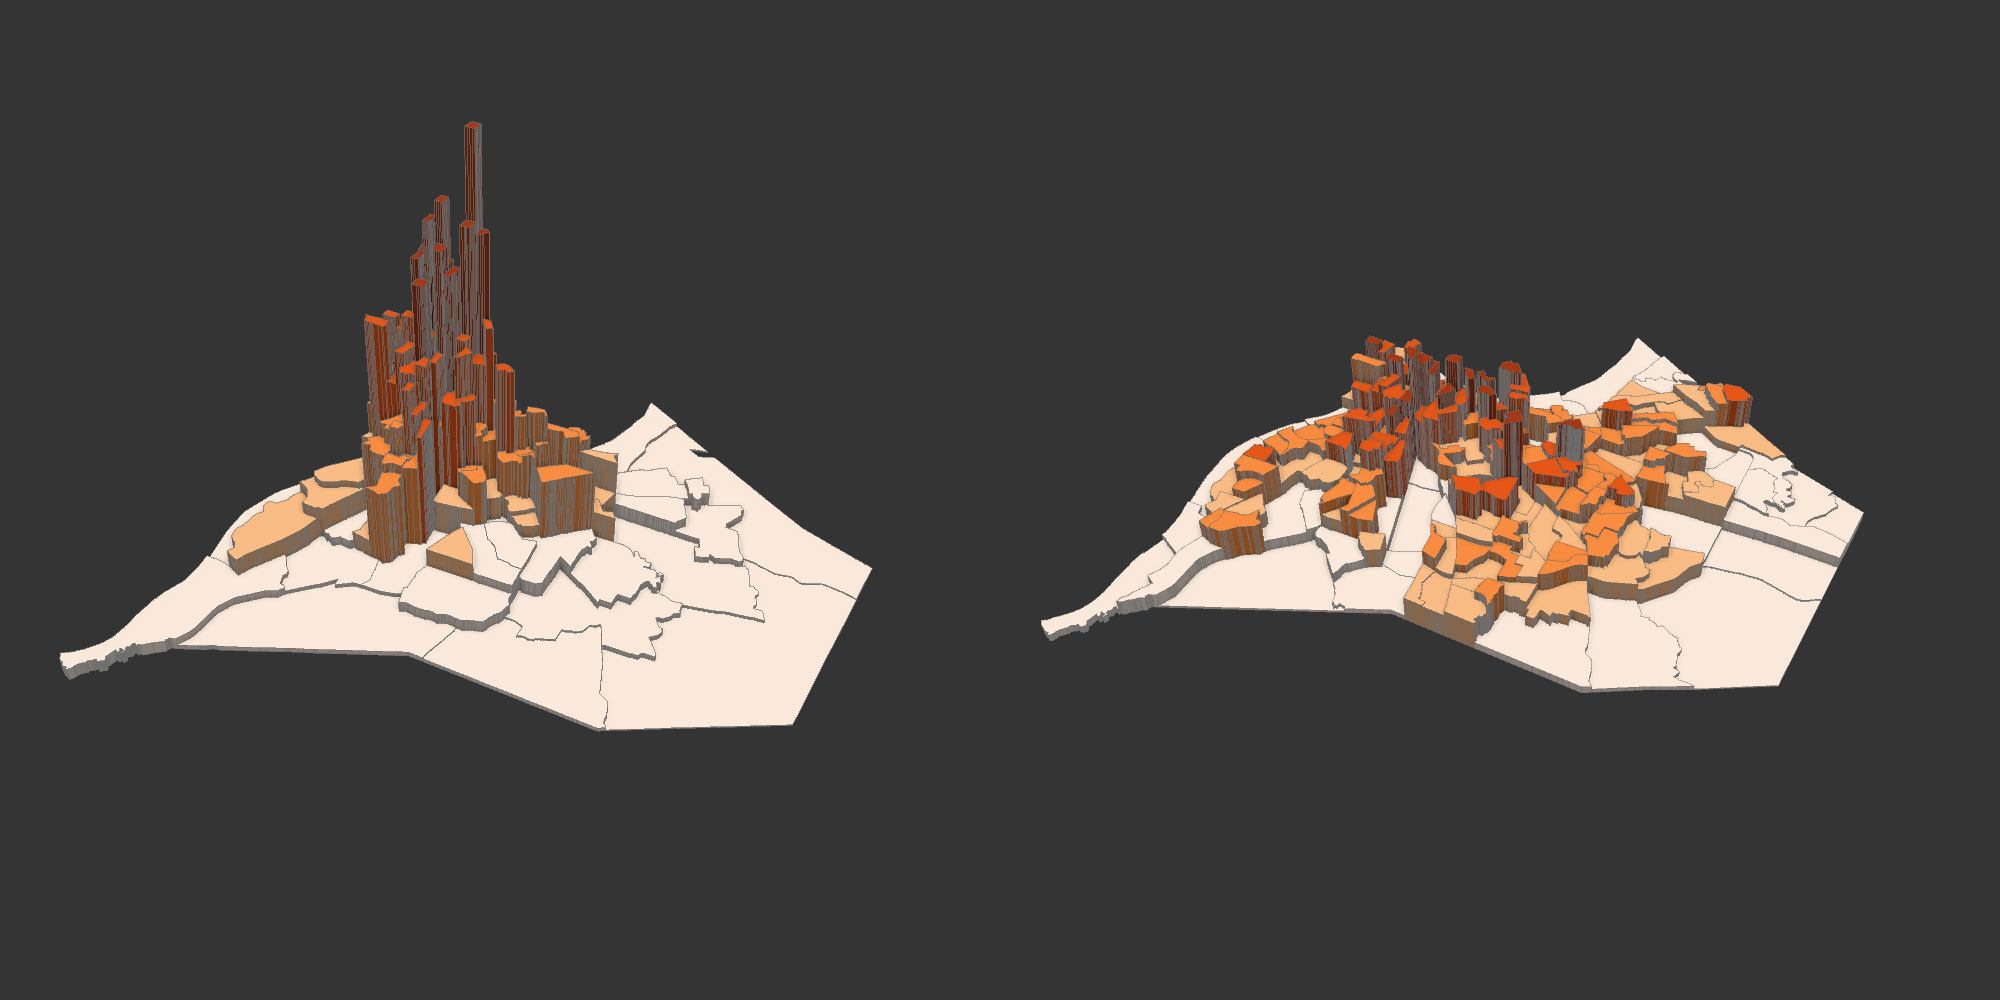
Generally, a person only “counted” for the mapping if they stayed in the park for at least five minutes. Their locations were put together as a heat map to show what parts of the square were most commonly used, and for visual clarity. Other important features such as benches and trees were also mapped as they are where people tend to congregate.
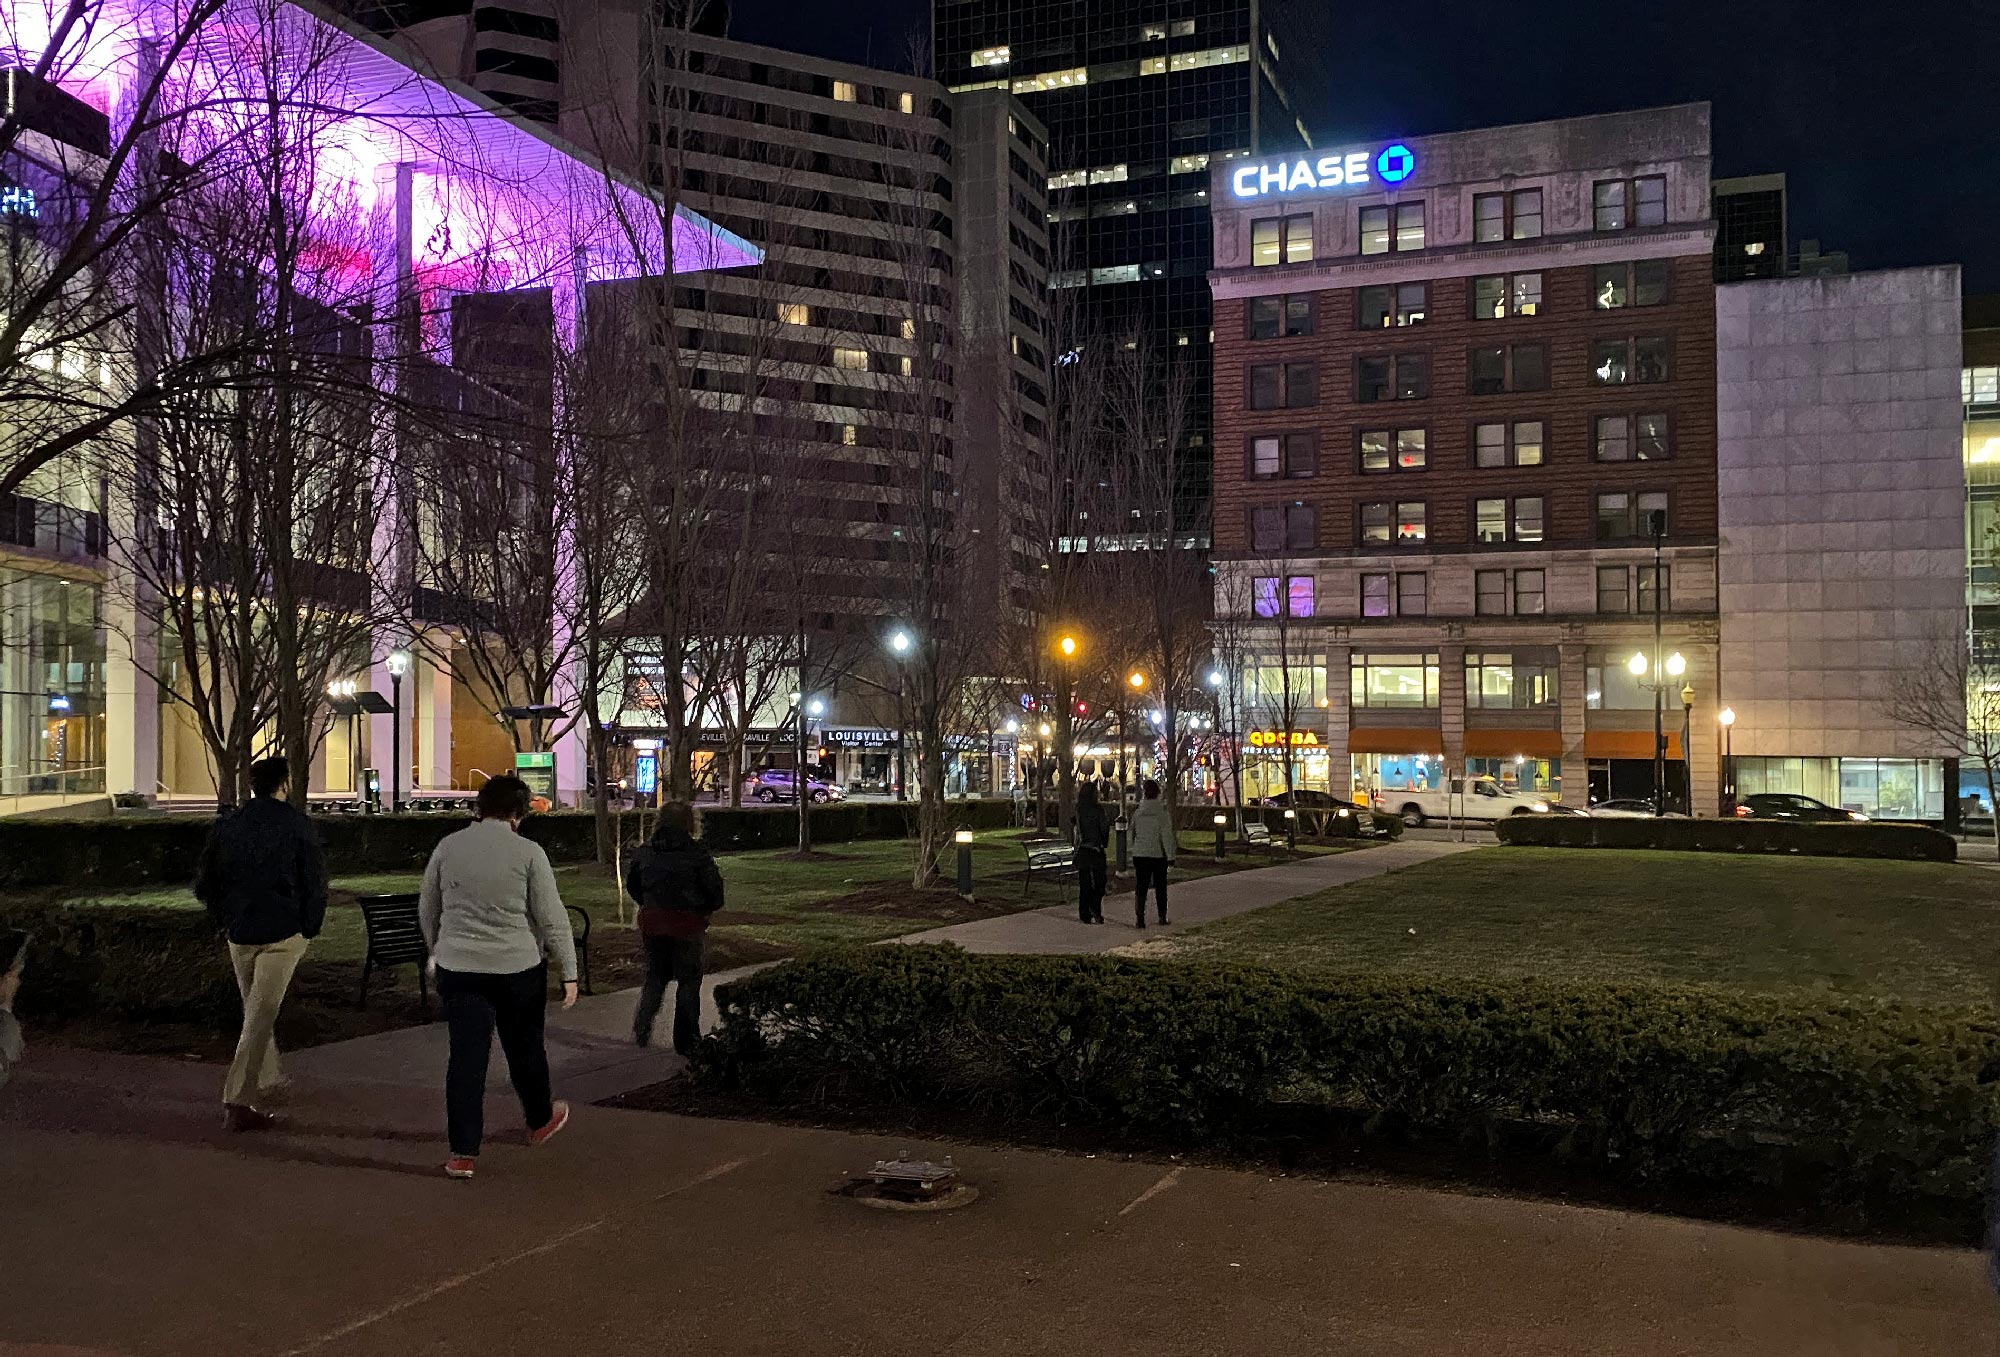
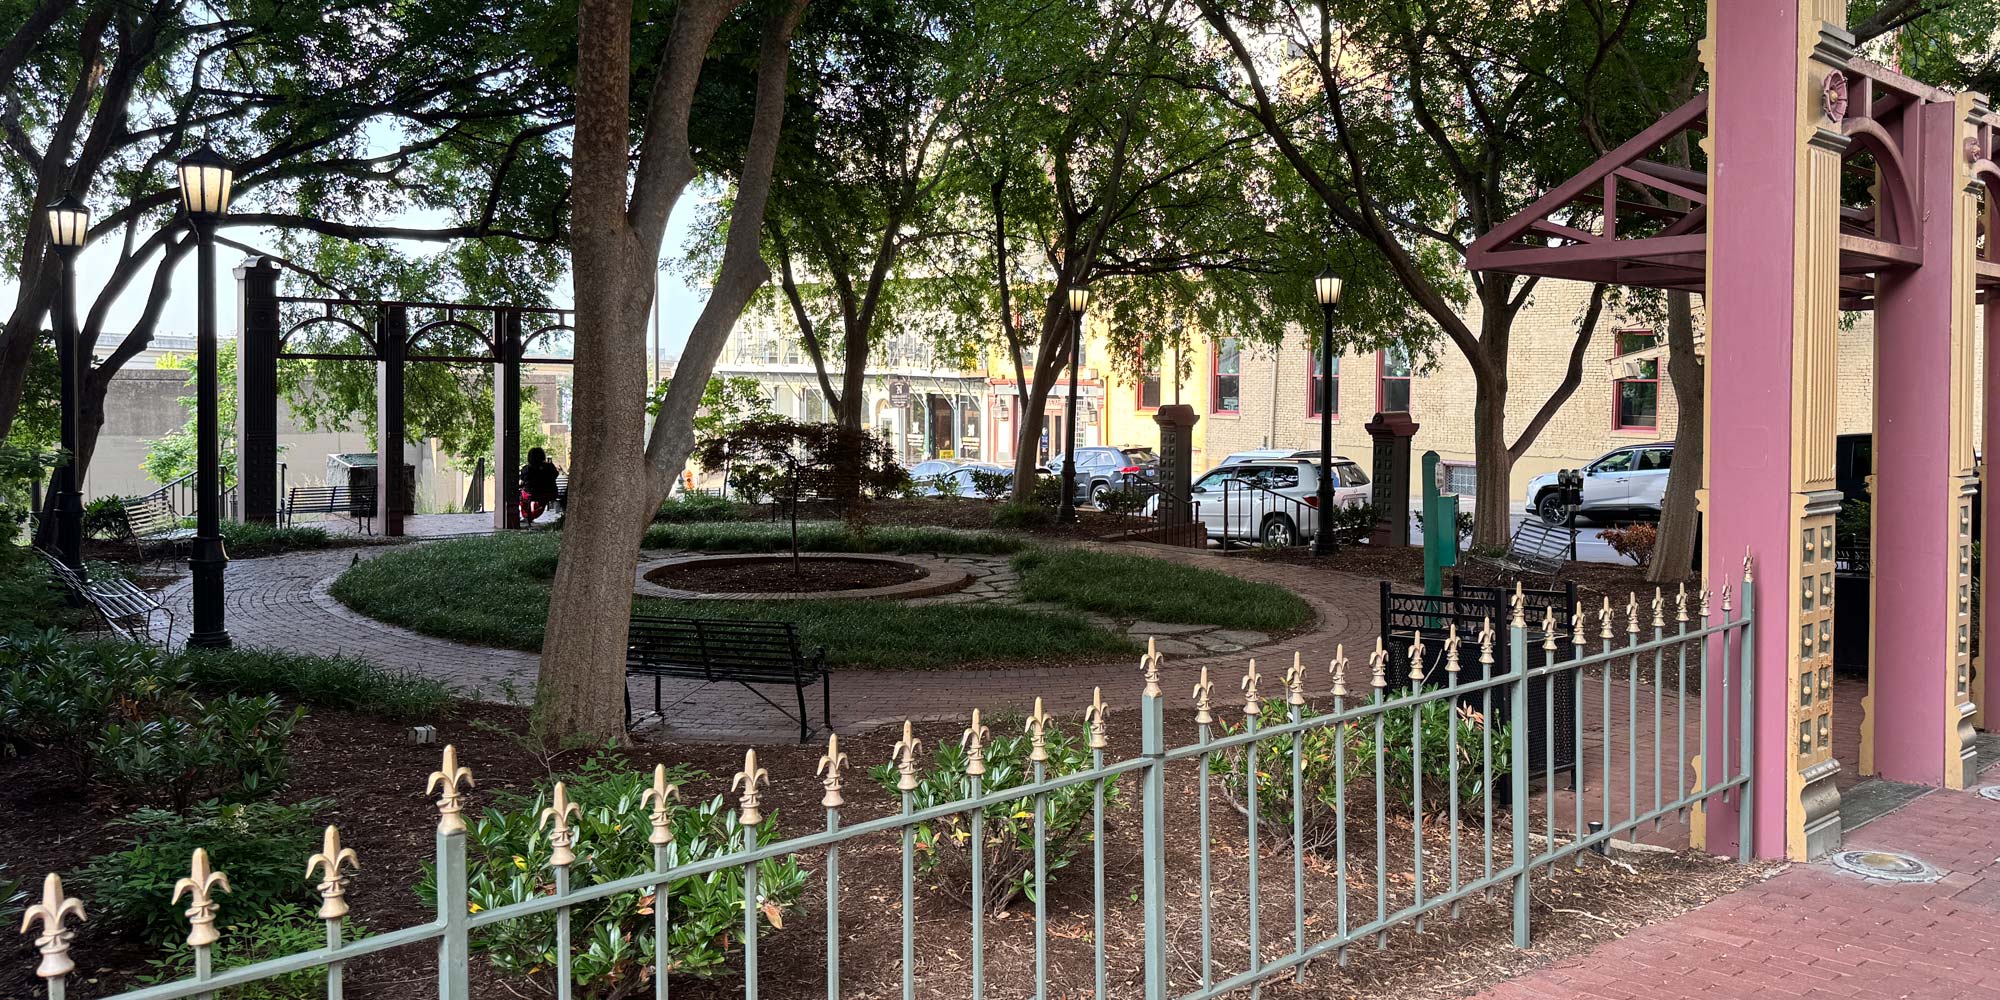
The results of the activity mapping show the northeast and southeast corners generally have the most activity. Many workers from the nearby metro 444 building take their breaks in the northeast corner, resulting in high amounts of traffic. Almost every major hotspot is towards the edge, as people congregate in these more shaded parts of the space. Outside of the shade, most would sit or stand near stations that provided doggie bags, as many of them were walking their dogs. The preference towards shade is overwhelming, but most observations were also made on days with decent weather during spring/summer.
Most park-goers sit and decompress in some way: using their phone, smoking, or talking with friends; those who stand tend to be nearby residents walking their dog. 60 percent of people go to the park alone, but 46 percent end up talking with others at the square, likely due to the public space helping to catalyze social interactions. You can see more on how people use the space in the dashboard below.
Click here to view the dashboard in its own window.